Advertisement
If you have a new account but are having problems posting or verifying your account, please email us on hello@boards.ie for help. Thanks :)
Hello all! Please ensure that you are posting a new thread or question in the appropriate forum. The Feedback forum is overwhelmed with questions that are having to be moved elsewhere. If you need help to verify your account contact hello@boards.ie
Hi all,
Vanilla are planning an update to the site on April 24th (next Wednesday). It is a major PHP8 update which is expected to boost performance across the site. The site will be down from 7pm and it is expected to take about an hour to complete. We appreciate your patience during the update.
Thanks all.

CC3 -- Why I believe that a third option is needed for climate change

Options
1606163656694

Comments

  • Registered Users Posts: 6,235 ✭✭✭Oneiric 3


    Go Jane!

    EQNInLP.png


    She puts the rest of us to shame.

    New Moon


  • Registered Users Posts: 22,234 ✭✭✭✭Akrasia


    Climate change adds energy to the oceans and atmosphere at a rate equivalent to exploding 5 hiroshema bombs every second Night and day.

    This is warming the oceans and fueling intense weather.

    Storm Dennis is potentially one of the most powerful weather events ever recorded in the North Atlantic,
    A once in a century storm becomes a once in a decade event, This comes in the years after very unusual hurricane formation, increases in the rate of explosive cyclogenesis such that it’s almost expected now with every storm....


  • Registered Users Posts: 8,219 ✭✭✭Gaoth Laidir


    Akrasia wrote: »
    Climate change adds energy to the oceans and atmosphere at a rate equivalent to exploding 5 hiroshema bombs every second Night and day.

    This is warming the oceans and fueling intense weather.

    Storm Dennis is potentially one of the most powerful weather events ever recorded in the North Atlantic,
    A once in a century storm becomes a once in a decade event, This comes in the years after very unusual hurricane formation, increases in the rate of explosive cyclogenesis such that it’s almost expected now with every storm....

    These current storms are forming on the boundary of an area of anomalously cold water around New Foundland, in the much larger anomalously cold area of NE Canada around Baffin Bay.

    You're getting carried away with the tabloid headlines again.


  • Registered Users Posts: 216 ✭✭posidonia


    Akrasia wrote: »
    Climate change adds energy to the oceans and atmosphere at a rate equivalent to exploding 5 hiroshema bombs every second Night and day.

    This is warming the oceans and fueling intense weather.

    Storm Dennis is potentially one of the most powerful weather events ever recorded in the North Atlantic,
    A once in a century storm becomes a once in a decade event, This comes in the years after very unusual hurricane formation, increases in the rate of explosive cyclogenesis such that it’s almost expected now with every storm....


    Indeed.


    But lets instead just rubbish some women (they must be young or old though) or promote various weird conspiracy theories - all that is much easier to do than facing reality is.


  • Registered Users Posts: 22,234 ✭✭✭✭Akrasia


    These current storms are forming on the boundary of an area of anomalously cold water around New Foundland, in the much larger anomalously cold area of NE Canada around Baffin Bay.

    You're getting carried away with the tabloid headlines again.
    I haven’t read a tabloid newspaper in 30 years.


  • Advertisement
  • Registered Users Posts: 8,219 ✭✭✭Gaoth Laidir


    Akrasia wrote: »
    I haven’t read a tabloid newspaper in 30 years.

    Really?

    https://www.thesun.co.uk/tech/10742347/ocean-warming-rate-hiroshima-bomb-climate-change/


  • Registered Users Posts: 22,234 ✭✭✭✭Akrasia


    I'm pretty sure I used the Hiroshema bomb comparison multiple times in the past. Are you saying the Sun is quoting me?
    (it used to be referred to as 4 Hiroshema bombs a second, it's increased to 5 due to the continuing increase in GHG emissions)
    Or is it possible that this information is available elsewhere other than the tabloid press?

    https://skepticalscience.com/earth-warming-5-atomic-bombs-per-sec.html
    https://thebulletin.org/2020/02/earth-is-heating-at-a-rate-equivalent-to-five-atomic-bombs-per-second-or-two-hurricane-sandys/

    Do you dispute this statistic by the way?


  • Registered Users Posts: 8,219 ✭✭✭Gaoth Laidir


    Akrasia wrote: »
    I'm pretty sure I used the Hiroshema bomb comparison multiple times in the past. Are you saying the Sun is quoting me?
    (it used to be referred to as 4 Hiroshema bombs a second, it's increased to 5 due to the continuing increase in GHG emissions)
    Or is it possible that this information is available elsewhere other than the tabloid press?

    https://skepticalscience.com/earth-warming-5-atomic-bombs-per-sec.html
    https://thebulletin.org/2020/02/earth-is-heating-at-a-rate-equivalent-to-five-atomic-bombs-per-second-or-two-hurricane-sandys/

    Do you dispute this statistic by the way?

    I'm sure the amount of energy is around this level alright. However, I note that the study conveniently starts in the late 1950s, hence not including the similar increases in the first part of the 20th century. See, therein lies the problem. Whatever the source (though the general public get their news from the tabloids or The Guardian (is there any difference?!)), the general public are oblivious to the fact that an almost similar increase was taking place 100 years ago. But that wouldn't be quite so dramatic a story, would it?


  • Registered Users Posts: 8,219 ✭✭✭Gaoth Laidir


    By the way, I think you're mixing up barotropicity (hurricanes) and baroclinicity (these storms). The two are not connected.


  • Registered Users Posts: 1,488 ✭✭✭Hooter23


    Oneiric 3 wrote: »
    Go Jane!

    EQNInLP.png


    She puts the rest of us to shame.

    Yes because its really ethical to spend all your money on gold and diamonds for yourself instead of donating that money to people that are literally dying because they are so poor...How generous of her:rolleyes:


  • Advertisement
  • Registered Users Posts: 6,235 ✭✭✭Oneiric 3


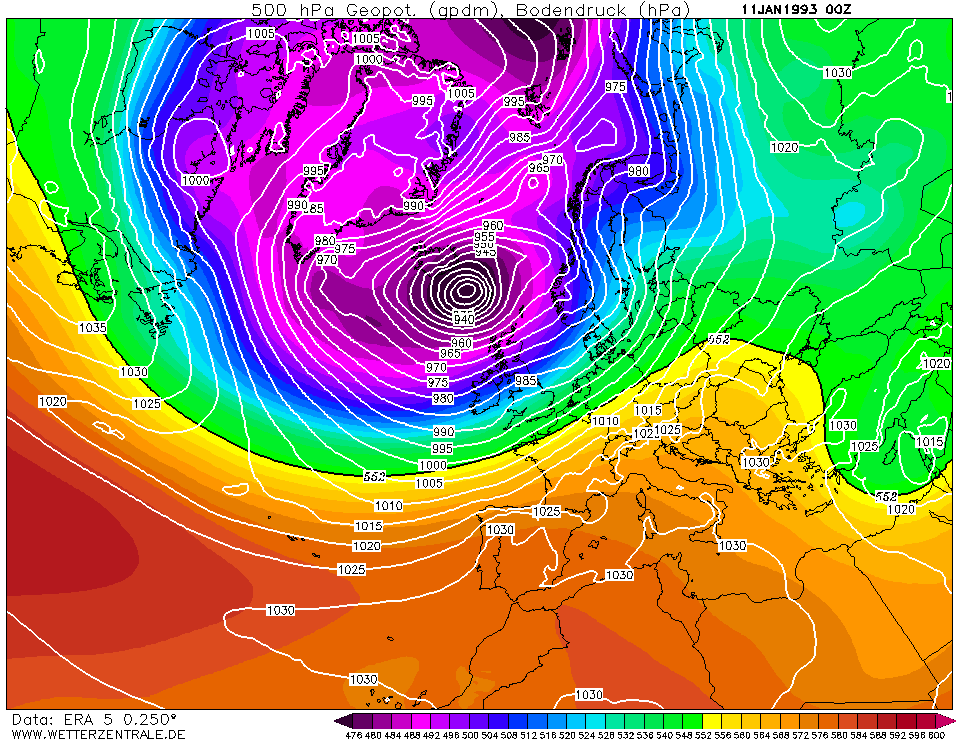
    Lowest winter storm pressure recorded in the N Atlantic was on January 11th, 1993, when the barometer fell down as low as 913 hPa off the north coast of Scotland.

    Reanalysis chart for that day:

    ERA_1_1993011100_1.png


    North Atlantic SST anomaly for that month: Nuclear strength heat fuelling storm:

    dbORat6.png

    And isn't it odd that for such a positively cyclonic winter so far across the N. Atlantic, that we here in Ireland, on the forefront of it all, have yet to experience what one might call a proper winter storm so far?

    Edit, looking more into that January 1993 low, it was actually on the 10th, and not the 11th as I earlier stated. UK Met hand drawn analysis chart for 18z that evening:

    dc88Vbo.png

    the 913 hPa seems to be more of a claim, but 916 hPa was official confirmed.

    New Moon


  • Registered Users Posts: 921 ✭✭✭MiNdGaM3


    I'm sure the amount of energy is around this level alright. However, I note that the study conveniently starts in the late 1950s, hence not including the similar increases in the first part of the 20th century. See, therein lies the problem. Whatever the source (though the general public get their news from the tabloids or The Guardian (is there any difference?!)), the general public are oblivious to the fact that an almost similar increase was taking place 100 years ago. But that wouldn't be quite so dramatic a story, would it?

    A similar increase happening 100 years ago is a fact? Where did you pull that fact from?


  • Registered Users Posts: 8,219 ✭✭✭Gaoth Laidir


    MiNdGaM3 wrote: »
    A similar increase happening 100 years ago is a fact? Where did you pull that fact from?

    The uptake started around 100 years ago and continues to this day.

    https://www.pnas.org/content/116/4/1126


    F1.large.jpg?width=800&height=600&carousel=1


  • Registered Users Posts: 14,326 ✭✭✭✭M.T. Cranium


    With regard to the very low central pressures of some modern-era North Atlantic storms ...

    I think these may have existed before the modern era too, but when we see reconstructed maps going back into the 19th century, they are not shown because the analysts had no reliable indications that such pressures existed. Today's modern technology gives us that indication, but as you know these pressures are inferred from satellite imagery and are (in most cases) not actually measured by ships or ocean buoys.

    The fact that very low pressures sometimes reached land based barometers (as in Dec 1886 when Armagh recorded 926 mbs) is probably an indirect proof that such pressures were "out there" in some North Atlantic storms that we see on charts reconstructed after the fact as 950 type centres.

    I don't think the human race is even responsible for one millibar of the deepening of Dennis or that 1993 storm or any other cyclonic storm or tropical storm. Half a millibar, maybe.


  • Registered Users Posts: 2,855 ✭✭✭Nabber


    Akrasia wrote: »
    I'm pretty sure I used the Hiroshema bomb comparison multiple times in the past. Are you saying the Sun is quoting me?
    (it used to be referred to as 4 Hiroshema bombs a second, it's increased to 5 due to the continuing increase in GHG emissions)
    Or is it possible that this information is available elsewhere other than the tabloid press?

    https://skepticalscience.com/earth-warming-5-atomic-bombs-per-sec.html
    https://thebulletin.org/2020/02/earth-is-heating-at-a-rate-equivalent-to-five-atomic-bombs-per-second-or-two-hurricane-sandys/

    Do you dispute this statistic by the way?

    It's a comparison used to bring nuclear power into the fray, associating it with something bad.
    It's the usual alarmist rhetoric. Could you also inform us of Greenland ice melts in Olympic sized swimming pools?


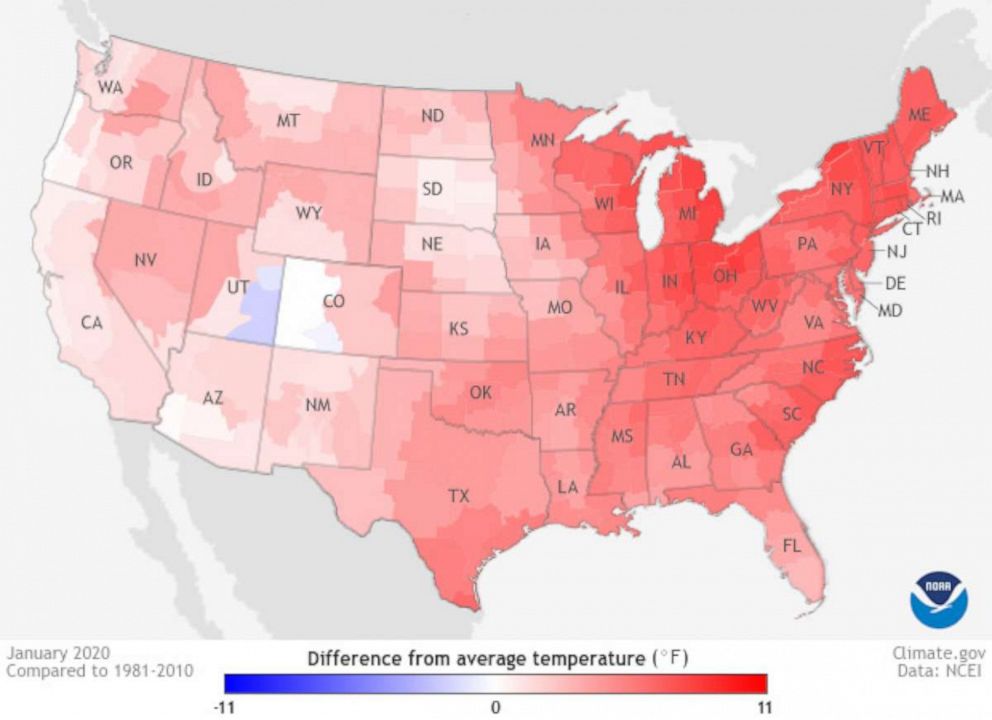
    On a side note, it's good to see Mother Nature respecting our borders, people in Utah must be freezing!

    temp-jan-ht-rc-200211_hpEmbed_11x8_992.jpg


  • Registered Users Posts: 1,488 ✭✭✭Hooter23


    If climate change is so bad why have we not had another "Night of the big wind" which was 180 years years ago... surely if the weather is much worse now we should have had many of these type storms by now...yet none of the storms we get nowadays even come close to that storm...strange


  • Registered Users Posts: 22,234 ✭✭✭✭Akrasia


    Hooter23 wrote: »
    If climate change is so bad why have we not had another "Night of the big wind" which was 180 years years ago... surely if the weather is much worse now we should have had many of these type storms by now...yet none of the storms we get nowadays even come close to that storm...strange

    I’m skeptical of your memory of that storm that happened more than a century before you were born


  • Registered Users Posts: 22,234 ✭✭✭✭Akrasia


    Nabber wrote: »
    It's a comparison used to bring nuclear power into the fray, associating it with something bad.
    It's the usual alarmist rhetoric. Could you also inform us of Greenland ice melts in Olympic sized swimming pools?
    Nuclear weapons are not the same as nuclear power. It is an analogy that shows how much energy is being added to the system in a way that makes sense on a human scale[/quote]


  • Registered Users Posts: 8,219 ✭✭✭Gaoth Laidir


    Akrasia wrote: »
    Nuclear weapons are not the same as nuclear power. It is an analogy that shows how much energy is being added to the system in a way that makes sense on a human scale

    Rubbish. Most lay people will have no idea how much energy is in a Hiroshima bomb. What would be much more easily understood would be "how many times the annual global domestic electricity usage" it equates to. The nuclear term is put in there purely as an association tool.


  • Registered Users Posts: 2,855 ✭✭✭Nabber


    Akrasia wrote: »
    Nuclear weapons are not the same as nuclear power. It is an analogy that shows how much energy is being added to the system in a way that makes sense on a human scale

    It’s a fantastically poor analogy. It’s also one that hasn’t changed in 10 years. 2010 was 4 a second, 2020 still 4 a second.


  • Advertisement
  • Registered Users Posts: 17,865 ✭✭✭✭Thargor


    Hooter23 wrote: »
    If climate change is so bad why have we not had another "Night of the big wind" which was 180 years years ago... surely if the weather is much worse now we should have had many of these type storms by now...yet none of the storms we get nowadays even come close to that storm...strange
    Likewise if its all just a liberal conspiracy by the worlds scientific community for whatever reasons then why have the 10 hottest years ever recorded all occurred in the last 15 years with last year being the second hottest ever seen? Its generally global heat thats considered a problem not storms hitting our minuscule little patch of the Earths surface.


  • Registered Users Posts: 8,219 ✭✭✭Gaoth Laidir


    Thargor wrote: »
    Likewise if its all just a liberal conspiracy by the worlds scientific community for whatever reasons then why have the 10 hottest years ever recorded all occurred in the last 15 years with last year being the second hottest ever seen? Its generally global heat thats considered a problem not storms hitting our minuscule little patch of the Earths surface.

    An apples and oranges argument. Nobody's denying that the earth is warmer now than it was 100 years ago. That's something that is "easily" measurable (though we've been through the problems with the methods), but attribution of winter storm properties to increased ocean heat content, as blindly stated by Akrasia above, is an althogether different story.


  • Registered Users Posts: 1,488 ✭✭✭Hooter23


    Thargor wrote: »
    Likewise if its all just a liberal conspiracy by the worlds scientific community for whatever reasons then why have the 10 hottest years ever recorded all occurred in the last 15 years with last year being the second hottest ever seen? Its generally global heat thats considered a problem not storms hitting our minuscule little patch of the Earths surface.

    The 1930s was the hottest decade on record in the US...and as for 10 hottest years on record recorded in the last 15 years...well they "estimate" sea temperatures by satellite which is two thirds of the planet...estimating something is not great science is it


  • Registered Users Posts: 17,865 ✭✭✭✭Thargor


    Hooter23 wrote: »
    The 1930s was the hottest decade on record in the US...and as for 10 hottest years on record recorded in the last 15 years...well they "estimate" sea temperatures by satellite which is two thirds of the planet...estimating something is not great science is it
    Every measurement is an estimate really, have you identified a specific problem with the methodology that the NOAA and NASA and all the rest might have missed? Anyway the US makes up ~6% of the worlds surface, cherrypicking such a small area is pointless (although would you happen to have a source for that out of curiosity?).


  • Registered Users Posts: 6,235 ✭✭✭Oneiric 3


    Thargor wrote: »
    Every measurement is an estimate really, have you identified a specific problem with the methodology that the NOAA and NASA and all the rest might have missed? Anyway the US makes up ~6% of the worlds surface, cherrypicking such a small area is pointless (although would you happen to have a source for that out of curiosity?).

    You seem to have a habit of reducing every region on earth to just irrelevant 'minuscule' patches. Yet, as in the case of the small 6% coverage of the US, the next time there is a heatwave, or a Cat 5 hurricane affecting the region we will be told that it will be down to global climate change and not very insignificant at all.

    As far as I am aware, the US has some of the longest temperature records on earth, this matters more than its 6% global surface.

    New Moon


  • Registered Users Posts: 14,326 ✭✭✭✭M.T. Cranium


    As you may know, that US map with the state borders seemingly in control of temperature anomalies is generated from county by county statistics, if a weather station happens to be located in a county (and most will have at least one) then that county gets the colour for that anomaly. As the counties are all within states, the map appears to show some arbitrary divisions but a human analyst would probably draw in more even divisions (isotherms) that did not conform to the state borders as much.

    This has been a rather nondescript winter for most of North America. A few places are running above normal for snowfall, notably northern Vermont and southern Quebec, but generally speaking the winter has been rather mild and inactive with few low pressure systems of any strength. Weather forum members are turning to stamp collecting and kite flying as new hobbies.


  • Registered Users Posts: 14,326 ✭✭✭✭M.T. Cranium


    I've used the term before, but if Greta is going to become famous for "how dare you" then I want to be remembered for "global blanding," that's my answer to the concept that we are seeing more frequent intense storms.

    We wish. The anecdotal nature of this claim does not stand up to rigorous analysis. The opposite is true, people have been fooled by the media spin following every significant weather event. For every one of those, there was probably a bigger one in the past before the warming began. And it makes sense. Storm development relies on a clash of air masses, so if the air masses are all getting a bit warmer, the clash is not as intense. Sure there will be exceptions but whenever one is challenged to name the worst storm of any type, almost invariably, the example that comes to mind is before 1980.

    Want to play?

    Worst storm to hit Ireland -- obviously 1839.

    Worst storm to hit the Irish Sea -- 1886

    Worst storm to hit southern England -- 1703

    Worst storm to hit the west coast of North America -- 1962

    Worst storm to hit the Great Lakes region -- perhaps a three-way tie here, 1843, 1913 and 1978 have good claims

    Worst typhoon of all time -- this is a subject of debate on weather forums, but from what I've read, the experts seem to think that several storms spread out over two centuries are about equal in their intensity.

    Worst hurricane landfall in continental US -- 1900

    Worst tornado outbreak in central US -- 1925 (second place 1974)

    Worst tropical cyclone in the Bay of Bengal -- 1970

    Worst tropical cyclone to hit Australia -- some say Tracy in 1974

    I'll ask this open question -- what category of extreme weather has seen its worst event since 1980?

    (not worst North American heat waves, those were in 1936, 1911, 1934)

    So getting back to my bid for famous words, global blanding ... we're stuck with it, and it's not all that exciting.


  • Registered Users Posts: 6,235 ✭✭✭Oneiric 3


    Had a quick look at the N. Hem temp anomaly for the year so far, and up to yesterday, they are running the 3rd highest in the CSFV2 series. Yet, with all this dangerous heat around in the top half of the globe (not that there is a 'top half') there does not seem to be much in the way of negative effects going on.

    214OlDy.png

    As M.T says above, 'global blanding' should become the new buzz word in climate alarmist circles.

    New Moon


  • Registered Users Posts: 1,488 ✭✭✭Hooter23


    Thargor wrote: »
    Every measurement is an estimate really, have you identified a specific problem with the methodology that the NOAA and NASA and all the rest might have missed? Anyway the US makes up ~6% of the worlds surface, cherrypicking such a small area is pointless (although would you happen to have a source for that out of curiosity?).


    More errors identified in contrarian climate scientists' temperature estimates
    What kinds of errors have been made? Well first, let’s understand how these two researchers measure atmospheric temperatures. They are not using thermometers, rather they are using microwave signals from the atmosphere to deduce temperatures. The microwave sensors are on satellites which rapidly circle the planet. 

    Some of the problems they have struggled with relate to satellite altitudes (they slowly fall over their lifetimes, and this orbital decay biases the readings); satellite drift (their orbits shift east-west a small amount causing an error); they errantly include stratosphere temperatures in their lower atmosphere readings; and they have incorrect temperature calibration on the satellites. It’s pretty deep stuff, but I have written about the errors multiple times here, and here for people who want a deeper dive into the details.

    It’s important to recognize that there are four other groups that make similar measurement estimates, so it’s possible to compare the temperatures of one group against another. The new paper, completed by Eric Swanson and published by the American Meteorological Society compares the results from three different groups. He focused on measurements made over the Arctic region. His comparison found two main differences amongst the three groups that suggests the errors.

    To better appreciate the issues, the satellites have instruments called Microwave Sounding Units (MSUs) or more recently, Advanced Microwave Soundings Units (AMSUs). These instruments allow reconstruction of the lower troposphere (TLT), the mid-troposphere temperature (TMT), and the lower stratosphere temperature (TLS). But the measurements are not at a specific location (like a thermometer) - they are smeared out over large spaces. As a consequence, it’s possible to have one layer of the atmosphere contaminate the results of another layer. You wouldn’t for instance, want your measurement of the troposphere (lower atmosphere) to include part of the stratosphere (above the troposphere).

    Among the key differences among the research teams are their methods to ensure this contamination is minimized. According to the recent paper, which was published in January 2017:

    At present, the UAH v6 (most recent Christy/Spencer data) results are preliminary and a fifth revision has now been released as v6beta5 (Spencer 2016). The release of the UAH version 6 products before publication is unusual, and Spencer recently stated that a manuscript has been submitted for a peer-reviewed publication. While some may find it scientifically inappropriate to utilize UAH v6b6 data before publication, these data have already been presented in testimony during congressional hearings before both the U.S. House and Senate and have also appeared on websites and in public print articles. 

    The author compared the Christy/Spencer data (UAH data) with another group (the RSS group) and found that the results diverged during the 1986-1988 time period. This shift “could arise from a step change or bias in either series.” When the author compared UAH with the third group (NOAA), the difference was still evident. However, when he compared RSS to NOAA, there was hardly a difference. 

    The author also noted that the timing of this divergence coincided with the merging of a new satellite NOAA-9, and this satellite has previously been identified as a source of error in the UAH results. But the author continued the analysis to more recent times and found another anomaly in 2005 which has since been corrected in NOAA.

    Look, measuring temperatures from satellites flying high above Earth is hard. No one doubts that. But let’s not be deluded into thinking these satellites are more accurate than thermometers (as some people suggest). Let’s also not blindly accept low-ball warming information from research teams that have long histories of revising their data. I created the image below a few years ago to show the upward revisions made by the Christy/Spencer team over time in their global troposphere temperatures.


    https://www.theguardian.com/environment/climate-consensus-97-per-cent/2017/may/11/more-errors-identified-in-contrarian-climate-scientists-temperature-estimates


  • Advertisement
  • Registered Users Posts: 2,855 ✭✭✭Nabber


    Wait till the ice melt season begins. Alarmist will be out in force. No mention of the ice growth this season it doesn’t fit the agenda.

    Come summer time we should see tabloid headlines and the ice experts calling out the ‘significant’ melt, some nonsense along the lines of 5th worst melt in record. Alway equating the gravity of the situation by placement on a leaderboard.

    Where the ranking lacks punch its altered to ‘worst in 50years’ rather than reporting ‘still not the worst on record’

    The public are fatigued with 30year constant doom, none of which has materialised.
    Maybe the planet is warming, maybe we don’t know why and maybe we have no idea of its impact. Currently that’s how it looks, with a best guess theory, as we as a species are reluctant to admit we “don’t know”... AGW is a new age religion born out of ignorance wrapped up in scientific postulations.


This discussion has been closed.
Advertisement