Advertisement
If you have a new account but are having problems posting or verifying your account, please email us on hello@boards.ie for help. Thanks :)
Hello all! Please ensure that you are posting a new thread or question in the appropriate forum. The Feedback forum is overwhelmed with questions that are having to be moved elsewhere. If you need help to verify your account contact hello@boards.ie
Hi all,
Vanilla are planning an update to the site on April 24th (next Wednesday). It is a major PHP8 update which is expected to boost performance across the site. The site will be down from 7pm and it is expected to take about an hour to complete. We appreciate your patience during the update.
Thanks all.

Sub-population question

Options
  • 22-09-2019 12:22am
    #1
    Registered Users Posts: 6,518 ✭✭✭


    I couldn't find a statistics forum so hopefully this is the right location for this question.

    I have a population of 15,000 with the following characteristics:

    median : 3.3
    avg : 4.3
    st dev : 3.5
    kurtosis : 19.05
    skew : 3.94

    Now from within that I have a smaller sub-population. There are 1,160 in this smaller set and it's characteristics are:

    median : 3.3
    avg : 3.9
    st dev : 2.5
    kurtosis : 28.16
    skew : 4.16


    Can I tell much from this data? This greater population has a higher standard deviation and a higher mean so I suspect that it contains a lot more higher value data. However the mean value is the same in both - does this mean that those high value data are not there in a large quantity?

    If I have 1 particular value from the entire population can I say with any confidence if it came from the smaller sub-poulation?


Comments

  • Registered Users Posts: 5,141 ✭✭✭Yakuza


    The lower SD in the smaller population would suggest that there are fewer large values in the smaller population.

    If you have one particular value, you wouldn't be able to say for definite what population it's in, but you could work out the probability of getting a value greater than that one with both populations and see which one it's more likely to be in.

    Both populations are quite large, so I'm going to assume they'll be normally distributed.

    For example, take a value of 9.
    For the first population, it has a z-score of (9-4.3) / 3.5 or 1.34 (to 2 sig figures). The one-tailled probability ("p-value") of getting a z-score of greater than this is around 9%.

    For the second population, the equivalent probability of getting a value greater than 9 is roughly 2%.

    You can't say for definite, but it's likelier that a value of 9 came from the first population.

    For values between the two means, it'd be pretty much a guess as the p-value would be very high in both cases.

    There are other tests (t-Test IIRC?) that you can do to see if both samples are from the same wider population but it's been decades since I looked at this stuff, sorry :(


  • Registered Users Posts: 6,518 ✭✭✭Brussels Sprout


    Thank you for the response. Just to pick up on your initial assumption - these data sets are not normally distributed. That was the reason for me supplying the skewness and kurtosis values (For a Normal Distribution these would both be 0)
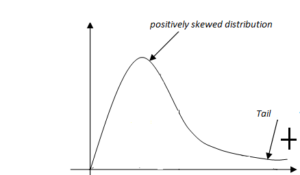
    If the skewness is between -0.5 and 0.5, the data are fairly symmetrical
    If the skewness is between -1 and – 0.5 or between 0.5 and 1, the data are moderately skewed
    If the skewness is less than -1 or greater than 1, the data are highly skewed

    Positively-skewed-distribution-300x175.png
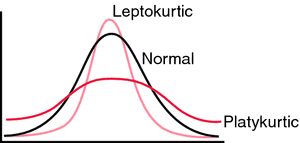
    Most often, kurtosis is measured against the normal distribution. If the kurtosis is close to 0, then a normal distribution is often assumed. These are called mesokurtic distributions. If the kurtosis is less than zero, then the distribution is light tails and is called a platykurtic distribution. If the kurtosis is greater than zero, then the distribution has heavier tails and is called a leptokurtic distribution

    X2604-K-11.png


    Combining the above graphs I believe that both of these distributions have peaks that are higher than for a normal distribution and long right-hand tails.

    Given that this is the case does that mean that I can still use the methods that you have described or is there an alternate test for these kinds of distributions?


  • Registered Users Posts: 3,761 ✭✭✭Donnielighto


    I couldn't find a statistics forum so hopefully this is the right location for this question.

    I have a population of 15,000 with the following characteristics:

    median : 3.3
    avg : 4.3
    st dev : 3.5
    kurtosis : 19.05
    skew : 3.94

    Now from within that I have a smaller sub-population. There are 1,160 in this smaller set and it's characteristics are:

    median : 3.3
    avg : 3.9
    st dev : 2.5
    kurtosis : 28.16
    skew : 4.16


    Can I tell much from this data? This greater population has a higher standard deviation and a higher mean so I suspect that it contains a lot more higher value data. However the mean value is the same in both - does this mean that those high value data are not there in a large quantity?

    If I have 1 particular value from the entire population can I say with any confidence if it came from the smaller sub-poulation?

    To the last question the short answer is no. The second population has a tighter distribution but it doesn't peak enough for any given value to be more likely to be the second population than the first due to the size difference .


  • Registered Users Posts: 5,141 ✭✭✭Yakuza


    Thank you for the response. Just to pick up on your initial assumption - these data sets are not normally distributed. That was the reason for me supplying the skewness and kurtosis values (For a Normal Distribution these would both be 0)


    Positively-skewed-distribution-300x175.png


    X2604-K-11.png


    Combining the above graphs I believe that both of these distributions have peaks that are higher than for a normal distribution and long right-hand tails.

    Given that this is the case does that mean that I can still use the methods that you have described or is there an alternate test for these kinds of distributions?

    My bad, thanks for the info. I haven't dealt with those moments about the mean in a long time and I'd completely forgotten their significance!


  • Registered Users Posts: 1,595 ✭✭✭MathsManiac


    Do you have the original data set?

    If so, histograms would be nice, as I'm having a bit of difficulty visualizing a distribution with the characteristics you describe. They are basically the same general shape, noting that the difference between the mean and the median is not far off a quarter of a standard deviation in each case, which is reflected in the largely similar skewness values, and the kurtosis isn't really that much different once you're into numbers of that size.

    If you plotted the two distributions first, you could eyeball them to see how different they look. Once you have a feel for it, you could then look at doing a statistical test to determine how different the sub-population really is from the overall population. You will probably need to use non-parametric methods, given how far from normal the distributions seem to be.

    Without seeing them I can't be sure, but I strongly suspect that, when answering your last question, the effect of any differences in shape characteristics between the two datasets will be dwarfed the discrepancies in their sizes, to the extent that the probability of a given number chosen from the overall population being a member of the smaller one will be close to 1160/15000, unless it's well out in a tail.


  • Advertisement
Advertisement