Advertisement
If you have a new account but are having problems posting or verifying your account, please email us on hello@boards.ie for help. Thanks :)
Hello all! Please ensure that you are posting a new thread or question in the appropriate forum. The Feedback forum is overwhelmed with questions that are having to be moved elsewhere. If you need help to verify your account contact hello@boards.ie
Hi all,
Vanilla are planning an update to the site on April 24th (next Wednesday). It is a major PHP8 update which is expected to boost performance across the site. The site will be down from 7pm and it is expected to take about an hour to complete. We appreciate your patience during the update.
Thanks all.

GERALD FLEMING ON RTE LAST NIGHT

Options
1234689

Comments

  • Closed Accounts Posts: 508 ✭✭✭d8491prj5boyvg


    There is a great book called "Factfulness: Ten Reasons We're Wrong About the World — and Why Things Are Better Than You Think"

    Excellent book and brings a level of calmness to a lot of the scaremongering in the world today. A book recommended by Bill Gates amongst others.

    Yes, we should be more mindful of the environment but let's not lose the run of ourselves.

    I haven't read it but I know bill gates is a big fan of projects like our world in data which highlights how far we've come on areas like poverty, child mortality, etc. If this book covers those topics, then I agree wholeheartedly. On the environment, I disagree. The science suggests something much worse than the popular consensus. To the extent that the average joe does not understand the risks we are facing. Nothing is certain but the negative outcomes are becoming more certain every day if we keep going as we are.


  • Closed Accounts Posts: 508 ✭✭✭d8491prj5boyvg


    Thanks for the link but that's the lazy reply. I asked you what the tipping points are and when you think that rate of rise will be achieved, given that you were quick to jump on my posts. You must know when if you're saying mine is wrong.

    So you don't want to read the evidence?


  • Registered Users Posts: 8,219 ✭✭✭Gaoth Laidir


    So you don't want to read the evidence?

    Oh I've read it before but nowhere does it mention when we'll reach 10 mm/yr or indeed what exactly the tipping points are. Since you were very fast in there to reject my points you must have done so knowing the answers. Since you're still unwilling to provide these answers yourself then the only conclusion I can come to is that you don't have a clue what they are and were merely disagreeing for the sake of disagreeing. The same old guff as easypass and others, who seem totally unable to think for themselves but are quick to pee on anyone who does.


  • Closed Accounts Posts: 508 ✭✭✭d8491prj5boyvg


    Oh I've read it before .

    Excellent.


  • Closed Accounts Posts: 508 ✭✭✭d8491prj5boyvg


    Oh I've read it before but nowhere does it mention when we'll reach 10 mm/yr or indeed what exactly the tipping points are. Since you were very fast in there to reject my points you must have done so knowing the answers. Since you're still unwilling to provide these answers yourself then the only conclusion I can come to is that you don't have a clue what they are and were merely disagreeing for the sake of disagreeing. The same old guff as easypass and others, who seem totally unable to think for themselves but are quick to pee on anyone who does.


    Disappointed in this reply - no need to get personal. I am not going to read the evidence for you. If you'd like to engage on the level of informed debate, let's do that. I am not interested in engaging in personal jibes.


  • Advertisement
  • Registered Users Posts: 2,855 ✭✭✭Nabber


    Disappointed in this reply - no need to get personal. I am not going to read the evidence for you. If you'd like to engage on the level of informed debate, let's do that. I am not interested in engaging in personal jibes.

    This is a very poor response, and a common tactic used to move the argument away from the actual debate. This is often seen on the side of debaters who are within the populist opinion but not versed on the topic at hand.

    I don't think you will be swayed to respond to Gaoth's request for you to back up your points with data, but will instead deflect the argument to accusations of wrong doing and personal jibes from posters who challenge your responses. It's disappointing but very common and expected from members of both sides of the AGW debate.

    The best bet here is to leave you out of further discussions until such time that you provided the evidence that supports your theorems. Common courtesy is to paste excerpts of the scientific data within your posts and then provide a link so that posters who agree and disagree with you can further educate themselves on where your information and thought process is stimulated from.


  • Moderators, Society & Culture Moderators Posts: 12,625 Mod ✭✭✭✭riffmongous


    Just some more food for thought. The loss in Swiss glaciers continues at the same rate as it was way back in 1860. No acceleration, despite what we're being led to believe. So both Arctic sea ice and the Greenland glaciers melts have leveled off and Swiss glaciers continue their normal loss coming out of the Little Ice Age.

    https://twitter.com/IncredibleClim1/status/1185193510275813376

    That's just wrong. 2 out of the 4 recorded the greatest rate of change from 1980 - 2000, and for a third it was the joint highest.


  • Registered Users Posts: 8,219 ✭✭✭Gaoth Laidir


    That's just wrong. 2 out of the 4 recorded the greatest rate of change from 1980 - 2000, and for a third it was the joint highest.

    Not according to the authors of the original paper. The greatest rate of loss was during the 1940s, with 1947 beating the heatwave year of 2003.
    [32] We averaged the mass balance series of the four investigated glaciers in order to investigate their year‐to‐year variability. Results are presented in Figure 7. Whereas winter balances display only minor changes during the last century, summer balances are subject to large fluctuations (Figure 7a). Mean specific net balances in the Periods I and III were slightly positive and led to advances of numerous glacier tongues URL="https://agupubs.onlinelibrary.wiley.com/doi/full/10.1029/2007JF000803#jgrf436-bib-0015"][COLOR=#0066cc][I]Glaciological Reports[/I], 1881–2002[/COLOR][/URL. The Periods II and IV are characterized by strongly negative mass balances (Table 4). Period IV includes 1998, 2003, and 2006, the years with the most negative net balances in the Swiss Alps determined within the conventional mass balance programs URL="https://agupubs.onlinelibrary.wiley.com/doi/full/10.1029/2007JF000803#jgrf436-bib-0015"][COLOR=#0066cc][I]Glaciological Reports[/I], 1881–2002[/COLOR][/URL. However, the mass balances in the 1940s (Period II) were more negative than those of Period IV (1998–2006). The results indicate that this is due to low winter balances during Period II (Figure 7b). Summer balances in Period IV are equally low as in the 1940s, but are partially compensated by relatively high amounts of winter precipitation. The two periods of mass gain are characterized by only slightly more winter accumulation, but significantly reduced melt in the summer months (Student's t test at a significance level of 99%). Summer balances are only half as negative as in the Periods II and IV (Figure 7). The most negative mass balance year since the end of the Little Ice Age was not the year 2003 with its exceptional European summer heat wave URL="https://agupubs.onlinelibrary.wiley.com/doi/full/10.1029/2007JF000803#jgrf436-bib-0032"][COLOR=#0066cc][I]Schär et al.[/I], 2004[/COLOR][/URL, but 1947.
    [50] We demonstrate that the mass balance evolution of four glaciers in the Swiss Alps has undergone significant fluctuations. Two decadal periods of mass gains are found, which are due to less negative summer balances. The general trend since 1865 is strongly negative, however, displaying large differences between neighboring glaciers. The most negative mass balances occurred in the 1940s. This is due to extraordinarily low winter accumulation and high summer temperatures. In future, we plan to extend the spatial coverage of the seasonal mass balance series to more than 20 glaciers in Switzerland in order to shed light on regional differences in high Alpine mass balance evolution. Our results emphasize the need to continue in situ mass balance measurements in seasonal resolution over long periods. We provide a promising method for combining these point measurements with geodetic observations and mass balance modeling to obtain mass balance quantities with high spatial and temporal resolution and extend measured mass balance series back in time.


  • Registered Users Posts: 8,219 ✭✭✭Gaoth Laidir


    Disappointed in this reply - no need to get personal. I am not going to read the evidence for you. If you'd like to engage on the level of informed debate, let's do that. I am not interested in engaging in personal jibes.

    I'm not asking you to read the evidence, just to tell me what your numbers are. That's a normal part of informed debate. I gave my numbers plus my sources, you just gave a "source" that had no numbers that you claim, and didn't give me the numbers either. See how ridiculous that is? Anyway, I'm obviously wasting my time so I'll take it that you don't know.


  • Moderators, Society & Culture Moderators Posts: 12,625 Mod ✭✭✭✭riffmongous


    Not according to the authors of the original paper. The greatest rate of loss was during the 1940s, with 1947 beating the heatwave year of 2003.

    Check the data, you can see it clearly. They've just used different, and importantly here, shorter time periods. Of course the shorter the period the higher your rate of change can be. Even then, it's still an acceleration compared to post 1940s, and it's certainly a far cry from your claim that the loss is at the same rate as it was back in 1860.


  • Advertisement
  • Registered Users Posts: 8,219 ✭✭✭Gaoth Laidir


    Nabber wrote: »
    This is a very poor response, and a common tactic used to move the argument away from the actual debate. This is often seen on the side of debaters who are within the populist opinion but not versed on the topic at hand.

    I don't think you will be swayed to respond to Gaoth's request for you to back up your points with data, but will instead deflect the argument to accusations of wrong doing and personal jibes from posters who challenge your responses. It's disappointing but very common and expected from members of both sides of the AGW debate.

    The best bet here is to leave you out of further discussions until such time that you provided the evidence that supports your theorems. Common courtesy is to paste excerpts of the scientific data within your posts and then provide a link so that posters who agree and disagree with you can further educate themselves on where your information and thought process is stimulated from.

    I think maybe these avid supporters of the climate furore here may be genuinely surprised at the actual data, as it goes against what they've been believing, thanks to the angle of the pro-climate argument. I notice that trends are becoming less and less quoted in favour of individual years now. "This year was the 2nd lowest"...."5 of the last 8 years have been the lowest"....etc. As I said before, if a decreasing curve has now flattened out then all the latest points along that part of the curve will be among the lowest on record. The ordinary Joe Sope won't know the difference and will continue to believe that the previous losses, whatever, are continuing.

    When you've been conditioned to believe a certain message, and are then provided with another that contradicts it, it's human nature to question the validity of that alternative message. That's fine, except it's important to question it in the correct way. Unfortunately, we haven't seen much of that recently.


  • Registered Users Posts: 8,219 ✭✭✭Gaoth Laidir


    Check the data, you can see it clearly. They've just used different, and importantly here, shorter time periods. Of course the shorter the period the higher your rate of change can be. Even then, it's still an acceleration compared to post 1940s, and it's certainly a far cry from your claim that the loss is at the same rate as it was back in 1860.

    Here we go again with the short time periods. If you have an issue, take it up with Matthias Huss et al.


  • Moderators, Society & Culture Moderators Posts: 12,625 Mod ✭✭✭✭riffmongous


    Here we go again with the short time periods. If you have an issue, take it up with Matthias Huss et al.

    It's not my fault if you can't get it. Go do a maths course instead of getting your info off Twitter

    No comment on the rest of your dodgy claims that the loss in Swiss glaciers continues at the same rate?


  • Registered Users Posts: 8,219 ✭✭✭Gaoth Laidir


    It's not my fault if you can't get it. Go do a maths course instead of getting your info off Twitter

    No comment on the rest of your dodgy claims that the loss in Swiss glaciers continues at the same rate?

    I took my info off the original paper that that Twitter post refered to. I provided a link to that paper and pasted two passages out of it. It is clear from the short time it took you to respond you didn't actually take the time to read the paper but had just about time to think up a cheap personal shot.


  • Registered Users Posts: 8,219 ✭✭✭Gaoth Laidir


    This is like trying to reason with chemtrailers.


  • Moderators, Society & Culture Moderators Posts: 12,625 Mod ✭✭✭✭riffmongous


    I took my info off the original paper that that Twitter post refered to. I provided a link to that paper and pasted two passages out of it. It is clear from the short time it took you to respond you didn't actually take the time to read the paper but had just about time to think up a cheap personal shot.

    Because it's clear you misinterpreted it. It doesn't back up what you were claiming


  • Registered Users Posts: 18,996 ✭✭✭✭gozunda


    There are tipping points.
    What are these tipping points? When will 10 mm/yr be achieved? Do you have a source?
    https://www.ipcc.ch/srocc/home/
    And references therein.

    I think you are mixing up theoretical references to actual projections.

    The IPCC do not use 'tipping points' in their modeling. In 2014 they defined a tipping point "as an irreversible change in the climate system" But made it clear "that the precise levels of climate change sufficient to trigger a tipping point remain uncertain".

    There is no mention of 'tipping points' in the IPCCs latest Report Summary for Policymakers.

    The references in the main report 2018 you linked above are at best abstract and refer to a range of possible theoretical scenarios only .


  • Registered Users Posts: 8,913 ✭✭✭Danno


    I follow with interest everytime a thread like this pops up (for its short lifetime it must be said) to see these arguments put out time and time again. The "climate change" revolution/rebellion/activism for me is nothing much more than a new religion. The Irish people have a unique mindset that is not far removed from Stockholm Syndrome. It took our forefathers 800 years to rid the majority of this isle of British rule, it took another 80 years to rid the majority of this isle of Rome rule, and right now we are entering another phase of foreign rule in the guise of a climate change church bargepolled in by the EU. I wonder when, if ever, we as a nation will actually see our own self-determination through peaceful means as our priority? Sadly, the generations of young Irish I see coming up are further away from this aspiration as ever. I despair.

    There is nothing wrong in trying to be as environmentally and ecologically conscious as possible in order to keep our land, waterways and airmass as close to purity as possible. However, if the means to achieve this puts our people at risk of regular hunger in this time of plenty, risk of poverty from over-taxed energy, risk of disease from polluted drinking or overtaxed water then that is a red line crossed.

    We do not have the capabilities of solving the largely imagined problems from Global Warming alone. We must rely, or contribute to, projects that offer REAL and cost-effective alternatives to our current system of living and consumption. When I see our government rise carbon taxes to "fight climate change" a part of me laughs, but the majority of me weeps because I know who gets "rode" the hardest with these measures - the ones who cannot afford to change, which is the majority of us. When I hear certain people "champion" carbon taxes and such punitive measures as being for the greater good, I would love to see them tried for treason.

    I've seen first hand how these "green" politicians apply their savagery. In July 2008 as the country was spiralling into a deep recession the Government of the day gave a huge reduction to car tax based upon carbon emissions - nice on the face of it, if you could pony up north of €20,000 for a new car in a recession. They then raised fuel costs by 23c a litre (over the course of three or four years) which murdered anyone with an "older" car who was already being crucified with excessive car tax. Imagine trying to save for a new car when the government are actively reducing your ability to save for a new car which they want you to buy!!!

    They are at the same again trying to get EVs in as the car of choice. Of course those with deep pockets who can afford a new EV (or those willing to go under the thumb of a bank/HP option) will get sweet deals and €5,000 off grants etc... whilst the poor gobshyte will have to wait to buy a hand-me-down EV in eight or nine years time - but will run the gauntlet of higher fuel prices in the mean time. They will also never get a grant to buy a hand-me-down car.

    Next up, our electricity market. We were told that renewables would lead to "cheaper electricity prices" as we wouldn't have to import as much fossil fuels. In the early 1990s we had the third cheapest electricity prices in the EU. Today we have the third dearest! Thanks to the EU who said that we must "open the market up to competition". Hence an "energy regulator" quango was set up and they quickly discovered that we had to "raise prices" to entice new entrants into the market because the ESB was too damn good at what it did - stable and cheap supply of energy whilst being able to pay handsome wages to its employees. Basically higher prices were needed to encourage competition - what a joke, and yes thats you and me the gobshyte paying again.

    Finally, it should be said to every climate "alarmist" to go take a long walk of a short plank and to come up with actual solutions and alternatives that are affordable to EVERYONE. Oh, and as for the current governments plan to accommodate 1mln extra people in Ireland by 2040 - are these extra people not going to contribute to carbon emissions??? Magic stuff.

    Getting back to the religion of climate change, here is a non-exhaustive list of their prophecies, see how many you can recognise:

    495537.jpeg

    Sorry for the long-winded rant. :D


  • Moderators, Society & Culture Moderators Posts: 12,625 Mod ✭✭✭✭riffmongous


    This is like trying to reason with chemtrailers.
    Just some more food for thought. The loss in Swiss glaciers continues at the same rate as it was way back in 1860.
    Rates of change for the 4 glaciers from 1860 - 1880 vs 1980 - 2000

    0.8 0.4 0.25 0.4
    vs
    0.8 0.7 0.5 0.7

    A near doubling for 3 of the 4 glaciers. Not a linear increase of course
    Huss wrote:
    The exact beginning and end of each period were set arbitrarily. Periods I (1912–1920) and III (1974–1981) are characterized by mass gains, Periods II (1942–1950) and IV (1998–2006) by extraordinarily high rates of mass loss.

    The time periods were picked specifically to identify the period of greatest change and compare it to the others.
    No acceleration, despite what we're being led to believe. So both Arctic sea ice and the Greenland glaciers melts have leveled off and Swiss glaciers continue their normal loss coming out of the Little Ice Age.

    The greatest rate of loss was during the 1940s

    They are using 8 year periods, again picked to give the greatest rates of change. Using the data from the graph which is organised more or less according to 20 year intervals, I calculated that the greatest rate of change has occurred within the last full 20 year period. Looking at the graph if I'd been able to use the most recent data the rates of change would be even larger. Considering all the glaciers are showing a loss trend over the entire time period, this is quite clearly an acceleration.

    Now you quoted
    The most negative mass balances occurred in the 1940s

    This is true. But we are talking about climate here and the not a handful of years. Sustained differences over 20 years are more significant than a cherry picked 8 year period when we are talking about a 140 year overall time period.
    It's also perhaps interesting to note that the amount of summer melt between the two periods was almost identical, and the 1940s period shows a lower net balance due to 'extraordinarily low winter accumulation'


  • Registered Users Posts: 28,805 ✭✭✭✭Wanderer78


    Danno wrote:
    Sorry for the long-winded rant.

    ...and shur that's all it was, I can't see any point in engaging in conversations about climate change.


  • Advertisement
  • Registered Users Posts: 19,306 ✭✭✭✭Drumpot


    I’m genuinely curious what annoys people here, is it the hyperbolic tabloid paper approach to promoting better practise (or more sustainable eco friendly alternatives) or is it that people think that man has no meaningful (or negligible) impact on our climate or is it just that we don’t know for sure and the data is being manipulated or interpreted incorrectly for some sort of mass conspiracy from governments so they can create taxes?


  • Closed Accounts Posts: 2,346 ✭✭✭easypazz


    Drumpot wrote: »
    I’m genuinely curious what annoys people here, is it the hyperbolic tabloid paper approach to promoting better practise (or more sustainable eco friendly alternatives) or is it that people think that man has no meaningful (or negligible) impact on our climate or is it just that we don’t know for sure and the data is being manipulated or interpreted incorrectly for some sort of mass conspiracy from governments so they can create taxes?


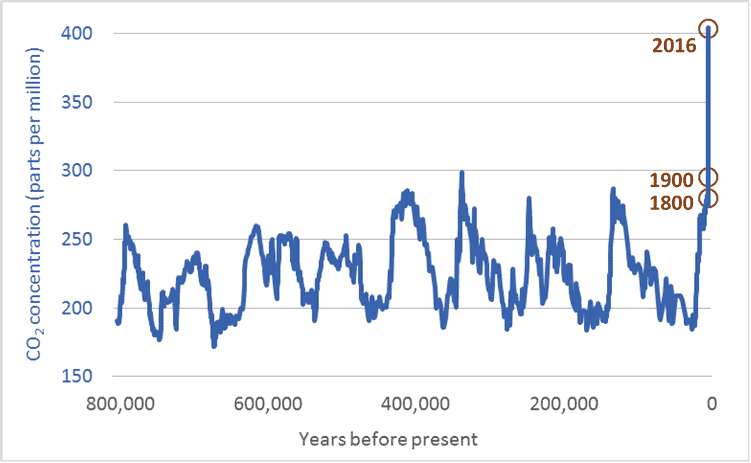
    Atmospheric-carbon-dioxide-CO2-levels-long-term-historic-800000-years.png

    This is the CO2 chart going back 800000 years, a massive spike as the population went from 1 Billion to nearly 8 Billion over the last 200 years or so.


  • Registered Users Posts: 8,913 ✭✭✭Danno


    Drumpot wrote: »
    I’m genuinely curious what annoys people here, is it the hyperbolic tabloid paper approach to promoting better practise (or more sustainable eco friendly alternatives) or is it that people think that man has no meaningful (or negligible) impact on our climate or is it just that we don’t know for sure and the data is being manipulated or interpreted incorrectly for some sort of mass conspiracy from governments so they can create taxes?

    A blend of all of the above, but the first and last points are especially acute. Also, you find many of those squealing most about climate change would give their right arm to have a socialism/communism revolution and see this green agenda as a perfect barge-pole for achieving this.


  • Registered Users Posts: 19,306 ✭✭✭✭Drumpot


    easypazz wrote: »
    Atmospheric-carbon-dioxide-CO2-levels-long-term-historic-800000-years.png

    This is the CO2 chart going back 800000 years, a massive spike as the population went from 1 Billion to nearly 8 Billion over the last 200 years or so.

    Was the industrial revolution playing much part in that spike? And what about gases released from below the ice as it melts?
    Danno wrote: »
    A blend of all of the above, but the first and last points are especially acute. Also, you find many of those squealing most about climate change would give their right arm to have a socialism/communism revolution and see this green agenda as a perfect barge-pole for achieving this.

    You see I’m generally cynical enough to allow alternative information to be accepted but “we don’t know for sure what might happen with regards to mans impact on our world so they shouldn’t be making it sound so bad” is not really a stance I can endorse. I’m not a scientist but I can’t accept that the way we treat the earth (deforestation, building on everything, raping every resource possible, mass consumerism which brings huge waste, gases produced from our food and vehicles, population growth etc) is sustainable or not eventually going to have severe consequences for us as a species.

    Now I gather people are not necessarily refuting this but it doesn’t look like mankind is particularly good at discussing these sort of issues like responsible adults. So in the absence of rational debate is it not at least better to have something, even if it is stupid headlines/propaganda that’s at least forcing discussion or potential change ?

    Like, if we are changing our planet that could severely damage our environment does it really matter if all the facts are right or how we are forced to change ? Is this not like parents stretching the truth with a child so that the child does the right thing even when they don’t want to?

    There are some posters in here whose views I respect but I’d love to know what they feel is most important and what we should do that’s realisticly feasible. I don’t like being bombarded with children giving lectures and climate change propaganda but I presume it’s the only way to communicate with the self absorbed masses who don’t respond to rational debates. We don’t have brexit and Trump because the majority of people generally like to make informed decisions , propaganda and hyperbole works....


  • Registered Users Posts: 28,805 ✭✭✭✭Wanderer78


    Danno wrote:
    A blend of all of the above, but the first and last points are especially acute. Also, you find many of those squealing most about climate change would give their right arm to have a socialism/communism revolution and see this green agenda as a perfect barge-pole for achieving this.


    Couldn't imagine many actually understanding what communism or socialism is to be honest, I certainly wouldn't want that, and I'm all for things such the green new deal etc


  • Registered Users Posts: 19,306 ✭✭✭✭Drumpot


    Surprised I never see people mention agenda 21 as it seems to certainly play a role in our climate change agenda.

    https://en.m.wikipedia.org/wiki/Agenda_21


  • Closed Accounts Posts: 40,061 ✭✭✭✭Harry Palmr


    Just looking through that list

    Killer bees moving north did happen (just not on a disaster movie scale)
    Ozone Depletion did happen, halted by global agreement
    Acid rain did kill lakes stone dead. Scrubbers and a move away from old king coal stopped damage getting worse. Lakes then recovered over time.
    Many people in massive cities wear gas masks when outdoors every day in 2019.
    96 months to save the world was not actually 8 years to stop mass eco collapse and total death, rather to slow/stop the process that would lead to mass eco collapse at a point within this century.
    Arctic will probably be ice free in summer in the next decade.
    Maldives and other atol type islands are on a knife edge in 2019.
    Super Hurricanes are here.

    Big fails are ice age and population growth leading to imminent collapse of ecosystems. The ice age thing was based on poor understanding Co2 and aerosols and other forms of atmospheric pollution - a view was that when it reached a certain PPM the particles would basically act as a shield against the sun and so cool the planet at ground level. The error was pointed out pretty quickly but news media was already propagating this falsehood so it stuck and is still referenced as if it has been orthodoxy. There is no reason to think science is always right every time but sceptics enjoy holding what is often hypothesis based on what is known at a given point to an extraordinarily high level as it suits them in their own propaganda.


  • Closed Accounts Posts: 163 ✭✭SaintLeibowitz


    This is like trying to reason with chemtrailers.

    I feel the same way about man made climate change denialists.


  • Registered Users Posts: 8,219 ✭✭✭Gaoth Laidir


    Rates of change for the 4 glaciers from 1860 - 1880 vs 1980 - 2000

    0.8 0.4 0.25 0.4
    vs
    0.8 0.7 0.5 0.7

    A near doubling for 3 of the 4 glaciers. Not a linear increase of course

    Ok, yes, I was wrong stating that the rate was the same as at around 1860. You are right in that the 1980-2000 (1986-2006 to be exact) period is higher than the 1860-80 one (1865-85 to be exact). I have measured these two periods (coloured boxes) and the increase in rate (height of the boxes) is in the range of 63-76% for the bottom three glaciers and 143% for the top (Silvretta, which has still only lost a small amount). Still not quite a doubling for 3 of them, but still higher than the earliest period, so hands up on that one.

    495602.png

    There's very little difference apparent from these graphs, though.

    495603.PNG

    The time periods were picked specifically to identify the period of greatest change and compare it to the others.


    They are using 8 year periods, again picked to give the greatest rates of change. Using the data from the graph which is organised more or less according to 20 year intervals, I calculated that the greatest rate of change has occurred within the last full 20 year period. Looking at the graph if I'd been able to use the most recent data the rates of change would be even larger. Considering all the glaciers are showing a loss trend over the entire time period, this is quite clearly an acceleration.

    Now you quoted


    This is true. But we are talking about climate here and the not a handful of years. Sustained differences over 20 years are more significant than a cherry picked 8 year period when we are talking about a 140 year overall time period.

    It's also perhaps interesting to note that the amount of summer melt between the two periods was almost identical, and the 1940s period shows a lower net balance due to 'extraordinarily low winter accumulation'

    It's always a balance between summer heat and winter accumulation, but at the end of the day the influence of the positive AMO periods (1920-50 and post 1997) is clear.


  • Advertisement
  • Closed Accounts Posts: 2,346 ✭✭✭easypazz


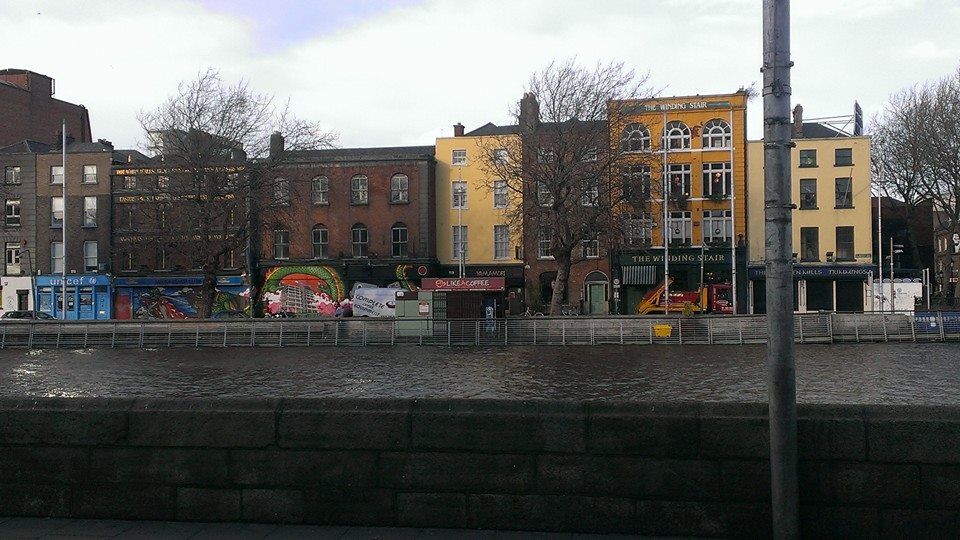
    Here is a pic of the Liffey about 200m from O'Connell bridge. Its already more or less level with the road. I know there is an incline to O'Connell bridge but its clear that if we got 400mm of sea level rise by 2050 there would be a lot of problems along the Dublin quays.

    An awful lot of flood defence work would need to be done around Ireland, but where would it stop, do we design for 1m, 2m, 5m?

    dublin-flood.jpg


Advertisement