Advertisement
If you have a new account but are having problems posting or verifying your account, please email us on hello@boards.ie for help. Thanks :)
Hello all! Please ensure that you are posting a new thread or question in the appropriate forum. The Feedback forum is overwhelmed with questions that are having to be moved elsewhere. If you need help to verify your account contact hello@boards.ie
Hi all,
Vanilla are planning an update to the site on April 24th (next Wednesday). It is a major PHP8 update which is expected to boost performance across the site. The site will be down from 7pm and it is expected to take about an hour to complete. We appreciate your patience during the update.
Thanks all.
The sun is dead!! Mini iceage???
Options
Comments
-
why would NASA want to beef up numbers or exaggerate the size of the sunspot?
http://spaceweather.com/images2010/21jun10/midi512_blank.gif?PHPSESSID=2do8r3do95p800da1pmir3rao7
Interesting graph here too on mean global temps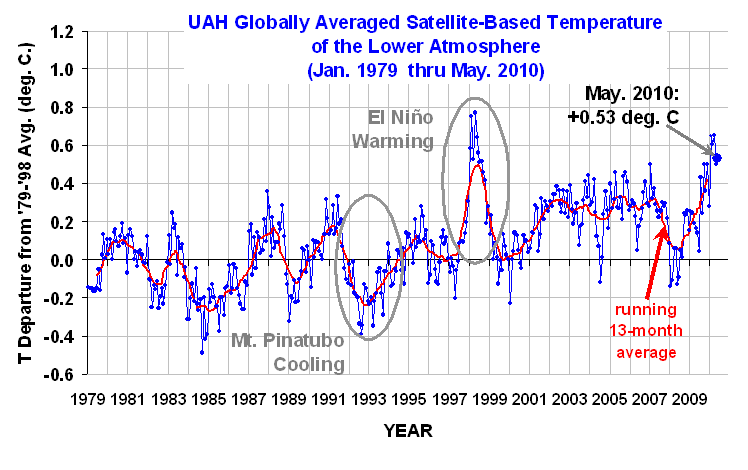 0
0 -
Nasa aren't picking the number anyway.
Here's the formula for the sunspot number:
The official SESC sunspot number is computed according to the Wolf Sunspot Number formula R = k(10g + s), where g is the number of sunspot groups (regions), s is the total number of individual spots in all the groups and k is a scaling factor that corrects for seeing conditions.
'k' is chosen for a particular observatory such that the calculation agrees with other observatories and is somewhat standardised.
I think Joe B_astardi isn't right in his point of view - the NOAA numbers are internally consistent and also can be correlated with historical observations and other observatories without too much difficulty.0 -
Evidence for solar forcing in variability of temperatures and pressures in Europe
FULL interesting PAPER
http://downloads.bbc.co.uk/looknorthyorkslincs/sun_climate_connection.pdf
(Quote)
The solar signature is best reflected in the wintertime temperature disturbances
(Quote)
The role of the Sun in global and regional climate change should be re-assessed and reasonable physical mechanisms are in sight.
0 -


And now an update on Sunspots,
A region which is most likely returning sunspot 1082 is hiding on the eastern limb and will soon rotate into view within the next 24-48 hours. This region was the cause of a Coronal Mass Ejection (CME) on Monday. The X-Ray flux has picked up and indicates a chance for C-Class flares. You can see the bright region in the latest SDO image below.

 0
0 -
Something to think about from Joe. Interesting stuff.
http://www.accuweather.com/video/110914873001/more-on-the-coming-cooling.asp?channel=vbbastaj0 -
Advertisement
-
I am still somewhat confused about what this means for the UK and Ireland. According to his predictive chart, we will experience above normal temps this winter? Excuse my ignorance...0
-
I am still somewhat confused about what this means for the UK and Ireland. According to his predictive chart, we will experience above normal temps this winter? Excuse my ignorance...
That chart won't play out exactly as shown as you know.
It takes the 3 month period as a whole so lets say jan is colder than normal but the other two months are somewhat above,then you would get slighty above average temps forecast,if that makes sense to you.
Overall global temps should be down so heres hoping that some cold blasts can rear its head far enough west to reach us from time to time.0 -
http://science.nasa.gov/science-news/science-at-nasa/2010/15jul_thermosphere/A Puzzling Collapse of Earth's Upper Atmosphere
July 15, 2010: NASA-funded researchers are monitoring a big event in our planet's atmosphere. High above Earth's surface where the atmosphere meets space, a rarefied layer of gas called "the thermosphere" recently collapsed and now is rebounding again.
Layers of Earth's upper atmosphere. Credit: John Emmert/NRL. [larger image] "This is the biggest contraction of the thermosphere in at least 43 years," says John Emmert of the Naval Research Lab, lead author of a paper announcing the finding in the June 19th issue of the Geophysical Research Letters (GRL). "It's a Space Age record."
The collapse happened during the deep solar minimum of 2008-2009—a fact which comes as little surprise to researchers. The thermosphere always cools and contracts when solar activity is low. In this case, however, the magnitude of the collapse was two to three times greater than low solar activity could explain.
"Something is going on that we do not understand," says Emmert.0 -
-
Well I suppose it couldn't have stayed quiet forever, well that's (probably) the theory of another Maundar minimum out the window.0
-
Advertisement
-
Deleted User wrote: »Well I suppose it couldn't have stayed quiet forever, well that's (probably) the theory of another Maundar minimum out the window.
Its still pretty quiet though. Compare the difference between these 2 images. In fairness these images are not like for like, as the 2001 pic was taken at more or less the peak of solar cycle 23. It will probably be around April 2013 that we see the peak of cycle 24.
28th July 2010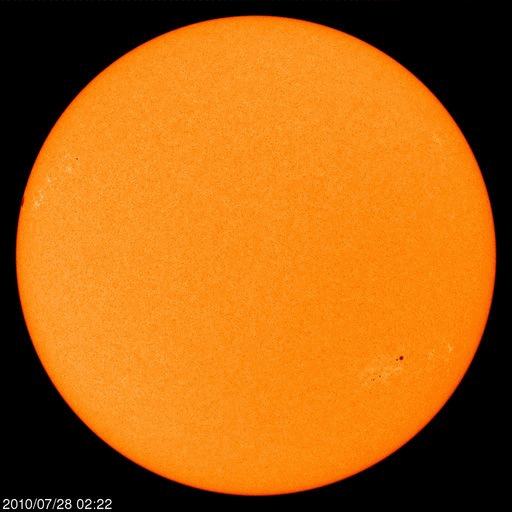
29th March 2001 0
0 -
Yes, I agree, Much quieter, but a Dalton minimum type event is still on the cards?0
-
Deleted User wrote: »Yes, I agree, Much quieter, but a Dalton minimum type event is still on the cards?
Yes leaning toward something similar to a Dalton.
It more likely will surpass that too but im expecting sunspots at there peak to reach the 90 mark per day.

 0
0 -
TV3 now talking about the sun and climate. TONIGHT WITH VINCENT BROWNE,kevin myers presenting with ger fleming on panel0
-
Well that was gas,i missed most of it but when Kevin asked Ger could he prove the link between Co2 and Climate change,he wormed his way out very well by just saying that he studies computer models and numbers,in other words NO.0
-
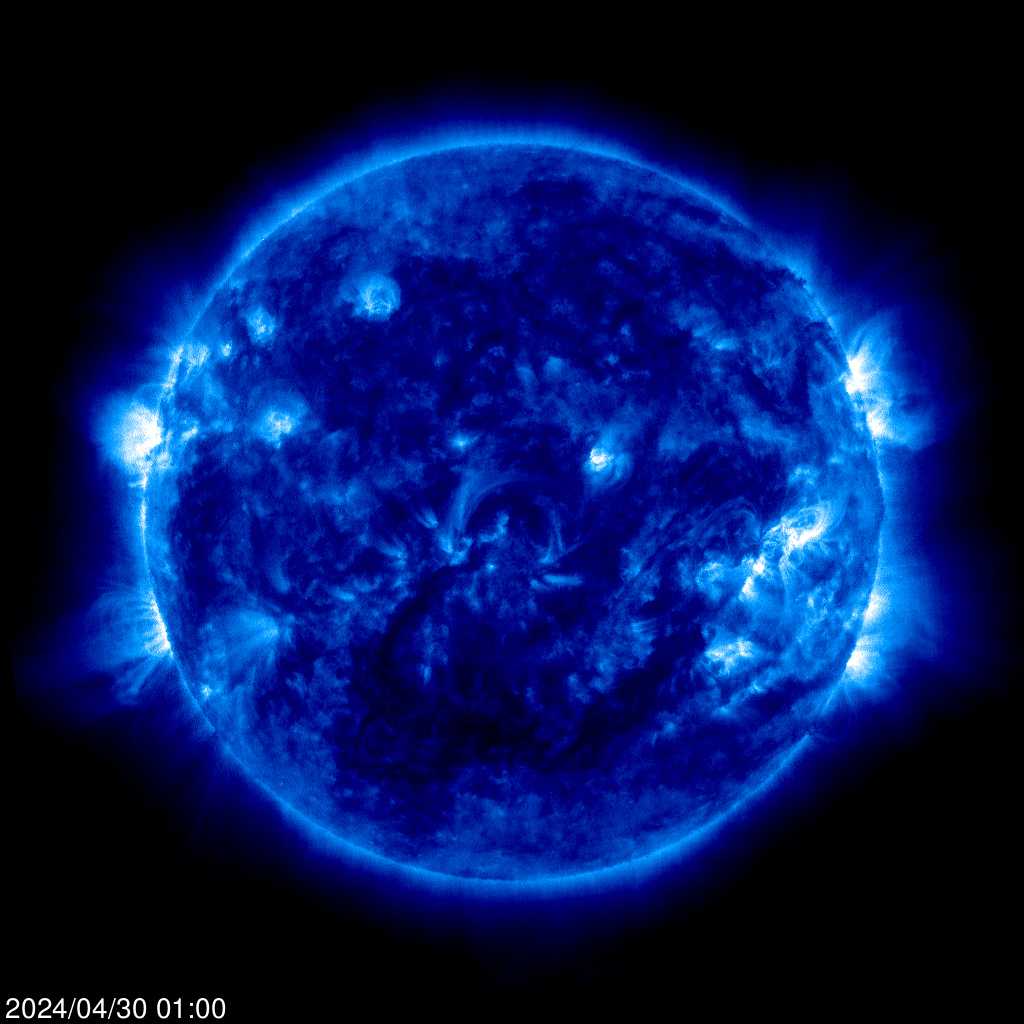
Today's Brilliant Sun.
Lets look at other factors now folks and talk about a bigger puzzle to piece together.
La Nina going strong
http://www.cpc.ncep.noaa.gov/products/analysis_monitoring/lanina/enso_evolution-status-fcsts-web.pdf
Relationship to Solar Activity and Cosmic Rays
The Nino 3.4 Index has a very strong correlation to solar irradiance and cloud cover.
The following figure shows the estimated solar output reaching the earth (upper figure) The declining solar irradiance from 1958 to 1975 corresponds to a general decreasing trend in the ENSO, followed by a shift to mainly positive values following the Pacific climate shift of 1976/77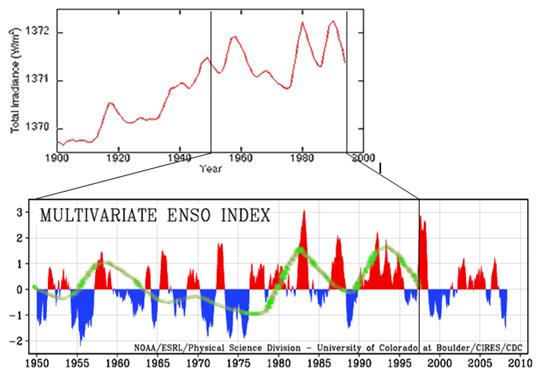
The following figure shows “Time-series of downward longwave radiation (DLR-A[3.4]), and net downwelling longwave radiation at the surface (NSL-A[3.4]) anomaly (defined with respect to the average monthly DLR for the whole study period 1984–2004) in the Ni˜no-3.4 region (black line). Overlaid is the time-series of the Ni˜no-3.4 index (red line)” (from Pavlakis et al, “ENSO surface longwave radiation forcing over the tropical Pacific” Atmospheric Chemistry and Physics 7, April 2007 URL="http://www.atmos-chem-phys.net/7/2013/2007/acp-7-2013-2007.pdf"][COLOR=#0000ff]http://www.atmos-chem-phys.net/7/2013/2007/acp-7-2013-2007.pdf[/COLOR][/URL).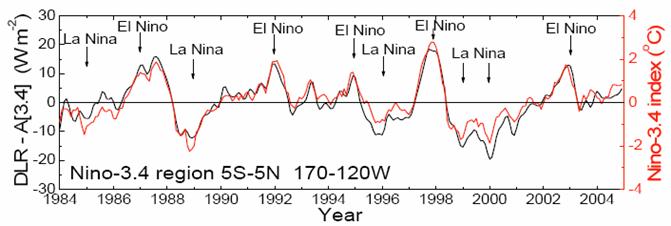
The following figure shows “Time-series of downward shortwave radiation anomaly (DSR-A) at the surface (defined with respect to the average monthly DSR for the whole study period 1984–2004) in the north subtropical region (7–15_ N 150–170_ E). Overlaid is the time-series of the Nino-3.4 index (red line).” from the study “ENSO surface shortwave radiation forcing over the tropical Pacific” (Pavlakis et al, Atmospheric Chemistry and Physics Discussions, 2008 URL="http://www.atmos-chem-phys-discuss.net/8/6697/2008/acpd-8-6697-2008-print.pdf"][COLOR=#0000ff]http://www.atmos-chem-phys-discuss.net/8/6697/2008/acpd-8-6697-2008-print.pdf[/COLOR][/URL)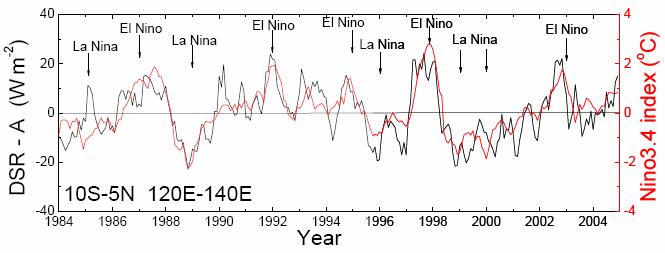
The above figures show an extremely strong correlation between downward solar radiation and the Nino 3.4 Index.
Downward radiation at the Earth’s surface is greatly affected by the amount of cloud cover. The following figure (from URL="http://bobtisdale.blogspot.com/2009/02/recharging-pacific-warm-pool-part-2.html"][COLOR=#0000ff]http://bobtisdale.blogspot.com/2009/02/recharging-pacific-warm-pool-part-2.html[/COLOR][/URL) shows the cloud amount (inverted, in red) from the International Satellite Cloud Climatology Program (ISCCP) dataset, along with the Nino 3.4 SST anomalies.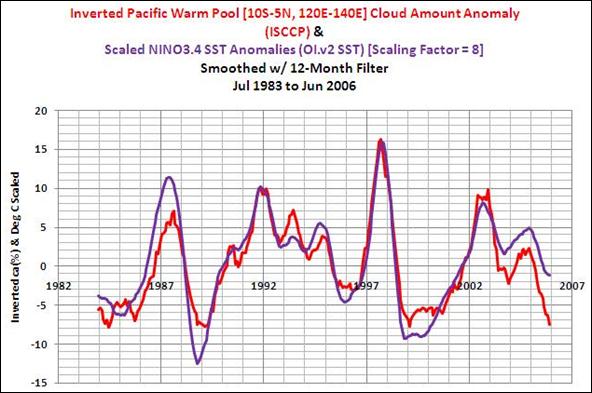
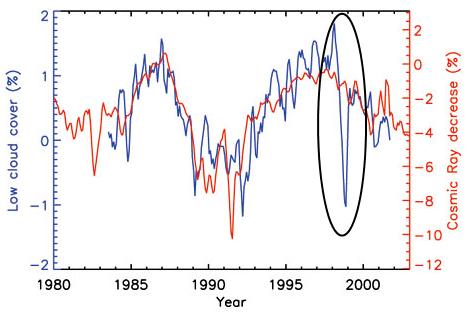
The following figure is from Marsh and Svensmark “Galactic cosmic ray and El Niño–Southern Oscillation trends in International Satellite Cloud Climatology Project D2 low-cloud properties” URL="http://www.agu.org/pubs/crossref/2003/2001JD001264.shtml"][COLOR=#0000ff]http://www.agu.org/pubs/crossref/2003/2001JD001264.shtml[/COLOR][/URL and shows the low altitude cloud cover (blue) as well as the cosmic ray flux (red). A sudden decrease in low cloud cover accompanied the 1997-98 El Nino.
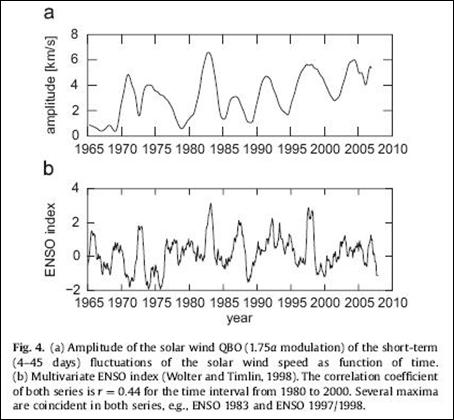
Further solar evidence is provided by a study of the solar wind quasi-biennial oscillation (Hocke, “QBO in Solar Wind Speed and its Relation to ENSO”, Journal of Atmospheric and Solar-Terrestrial Physics
The following figure is from that paper showing a correspondence between peaks in solar wind amplitude and ENSO index.
A 1988 study (R. Pérez-Enríquez, B. Mendoza1 and M. Alvarez-Madrigal, “Solar activity and El Niño: the auroral connection” found “A significant correlation is found between the distribution of the data around that maximum, suggesting a connection between the phenomenon of El Niño and the solar activity which gives rise to aurorae. We interpret the results in terms of a possible change of the global circulation pattern of the ocean induced by temperature increases of a few degrees at the auroral zone, as proposed by some authors, which may trigger El Niño.”
A 2007 study (Vovk, V.; Egorova, L., “Role of solar activity in formation of the anomalous El Nin'o current”, Geomagnetism and Aeronomy, Volume 47, Number 1, February 2007 found “a sharp decrease in the SOI indices, which corresponds to the beginning of El Nin'o (ENSO), is preceded one or two months before by a 20% increase in the monthly average Wolf numbers. In warm years of Southern Atmospheric Oscillation a linear relationship is observed between the SOI indices and the number of geoeffective solar flares with correlation coefficients p < −0.5. It is shown that in warm years a change in the general direction of the surface wind to anomalous at the above stations is preceded one or two days before by an increase in the daily average values of IMF Bz. An increase in the SOI indices is preceded one or two months before by a considerable increase in the monthly average values of the magnetic AE indices.”
A study published in 2008 (Robert Baker, “Exploratory Analysis of Similarities in Solar Cycle Magnetic Phases with Southern Oscillation Index Fluctuations in Eastern Australia” Geophysical Research Papers, Vol. 46, 2008) states: “There is growing interest in the role that the Sun's magnetic field has on weather and climatic parameters, particularly the ~11 year sunspot (Schwab) cycle, the ~22 yr magnetic field (Hale) cycle and the ~88 yr (Gleissberg) cycle. These cycles and the derivative harmonics are part of the peculiar periodic behaviour of the solar magnetic field. Using data from 1876 to the present, the exploratory analysis suggests that when the Sun's South Pole is positive in the Hale Cycle, the likelihood of strongly positive and negative Southern Oscillation Index (SOI) values increase after certain phases in the cyclic ~22 yr solar magnetic field. The SOI is also shown to track the pairing of sunspot cycles in ~88 yr periods. This coupling of odd cycles, 23–15, 21–13 and 19–11, produces an apparently close charting in positive and negative SOI fluctuations for each grouping. This Gleissberg effect is also apparent for the southern hemisphere rainfall anomaly. Over the last decade, the SOI and rainfall fluctuations have been tracking similar values to that recorded in Cycle 15 (1914–1924). This discovery has important implications for future drought predictions in Australia and in countries in the northern and southern hemispheres which have been shown to be influenced by the sunspot cycle. Further, it provides a benchmark for long-term SOI behaviour.”
A study of solar magnetic clouds during 1994 - 2002 by Wu, Lepping & Gopalswamy, “Solar Cycle Variations of Magnetic Clouds and CMEs” URL="http://www.scostep.ucar.edu/archives/scostep11_lectures/Pap.pdf"][COLOR=#800080]http://www.scostep.ucar.edu/archives/scostep11_lectures/Pap.pdf[/COLOR][/URL states: “The average occurrence rate is 9 magnetic clouds per year for the overall period (68 events/7.6 years). It is found that some of the frequency of occurrence anomalies were during the early part of Cycle 23: 1. Only 4 magnetic clouds were observed in 1999, and 2. An unusually large number of magnetic clouds (16 events) were observed in 1997 in which the Sun was beginning the rising of Cycle 23.” This “unusually large number of magnetic clouds” may have been the trigger of the significant 1997-98 El Nino.
PDO – Solar Connection
The following figure compares the major PDO events with the sunspot cycles (the sunspot cycle figure below is from: http://solarscience.msfc.nasa.gov/SunspotCycle.shtml). The major PDO events occur at the start of a sunspot cycle on an approximate 22-year cycle (22 years is also the solar Hale Cycle – the sun’s magnetic field reverses with each sunspot cycle and thus after two sunspot cycles the magnetic field has completed a reversal cycle – a Hale Cycle – and is back to where it started). In the early 1900’s the sunspot activity was quite low and there were no major PDO events. (The first major PDO event in the 1900s was in 1934 – the warmest year on record in the United States.)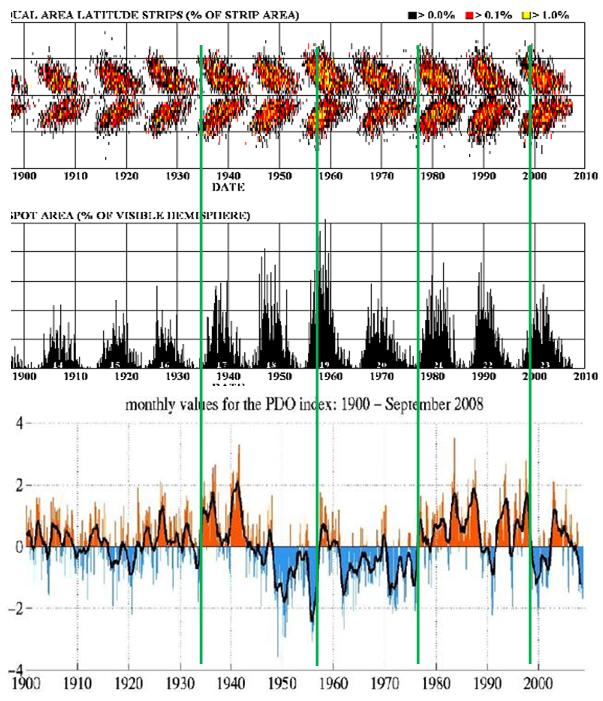 0
0 -
Hey MT,went through that NW thread and tis very interesting indeed.
I was looking at something like that too but with
http://landscheidt.auditblogs.com/2008/11/06/are-neptune-and-uranus-the-major-players-in-solar-grand-minima/
Here's a taste of the website,
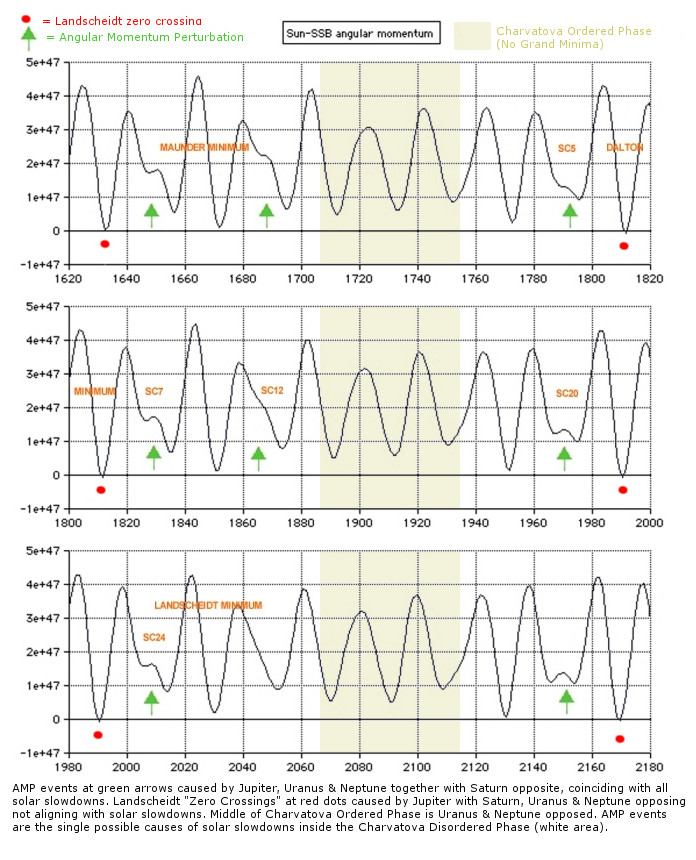
Neptune and Uranus Control Grand Minima & Solar Modulation?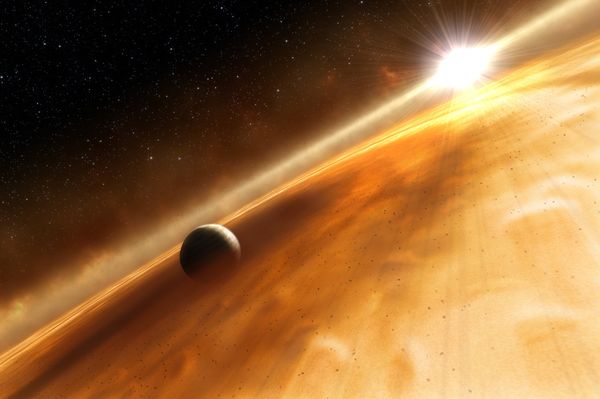 Originally set up by Carl Smith as a discussion point and repository of Theodor Landscheidt's work.Carl has recently left us, but he has also left us a legacy. His now famous Angular Momentum Graph gives us far more precise information of how the solar system planets affect the Sun. The "bumps" on Carl's graph here line up precisely with 3 distinct occurrences.1. The Sun's path around the centre of the solar system is radically changed.2. The 4 giant gas planets are in the same position.3. The Sun's output is greatly reduced.There can be no doubt that Angular Momentum and in particular Neptune & Uranus are a marker for the underlying driver for overall solar cycle modulation as well as Grand MinimaThis first article is a work in progress report that was born by his SSB graph which showed to me the importance of Neptune and Uranus. We are living in exciting times and may witness a brand new area of science, especially if we DO experience a Grand Minimum beginning with Solar Cycle 24.———————————————-
Some time ago while researching some of my interests in areas such as meteorology, the cosmos and perceived man-made global warming I came across this website and in particular a very interesting graph which Carl Smith created showing an extension to Dr. Landscheidt”s work. After studying Carl’s graph it became apparent to me that Neptune & Uranus are responsible for Solar Grand Minima as well as Solar Cycle Modulation.
In this article I will present Solar System Charts and Sunspot charts which correspond with some of the Angular Movements below in Carl’s graph.
The basic theory on how Neptune & Uranus control Solar Grand Minima and Solar Cycle Modulation is as follows: Shown in Carl’s graph below is a wave modulation mainly created by Jupiter & Saturn together (top of wave)and Jupiter & Saturn opposing (bottom of wave) which effectively is the momentum engine of the Sun, the top of the wave is strong, the bottom is weak (weaker means stronger cycle). Every 179 yrs Neptune & Uranus gather behind Jupiter (the largest gravity source besides the Sun) giving it extra momentum force and IF Saturn is on the other side of the Sun, the “down” cycle is shortened and not as weak because of the reduced momentum to Saturn….this coincides every time with less sunspot activity for the last 1000 yrs at least. Just discovered in an extension I recently finished to Carl’s graph back to 900AD is another line up that also causes Grand Minima before the Medieval Warm Period, over time Jupiter and Saturn gather on the other side of Neptune & Uranus causing disturbance at the top of the “wave” and substantially shortening the “up” cycle. Neptune and Uranus are the controllers of the 2 main drivers creating angular momentum, they can add or take away that momentum. The sunspot cycle modulation follows that control or momentum curve as shown in a graph later in the report.
I believe we can now confidently predict Solar Grand Minima and Solar Cycle Modulation strength.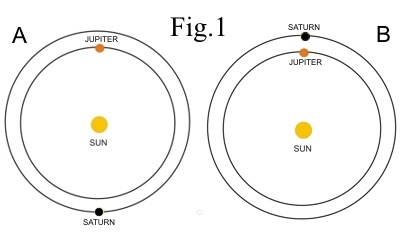
Fig.1 shows the 2 planetary positions that create the majority of angular momentum in our solar system. “A” corresponds with the bottom of the wave in Carl’s graph and “B” with the top of wave. The resonance created from large strength in “B” and near zero strength in “A” as Jupiter & Saturn balance each other out.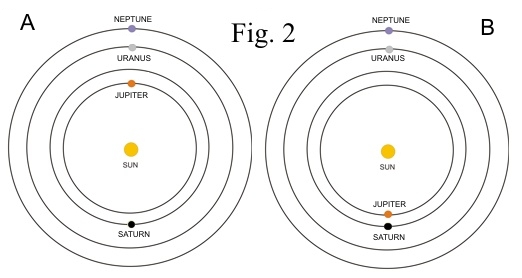
Fig.2 shows the 2 planetary positions capable of creating Grand Minima. “A” robbing Saturn at bottom of wave and “B” robbing Jupiter/Saturn at top of wave. Both positions responsible for the recurring “camels humps” in Carl’s graph
0 -
folks,
what can we expect over the next few years, there's alot on the web about solar cycle 24, another dalton etc. what could it mean for ireland, could we get more of last winter?0 -
Oh where's Nostradamus when you need him eh!!!!!
And even he made his quatrains near impossible to get heads around.
Well i could say yes to your questions,
Yes a Dalton like minimum is possible,however we simply have to wait and see what manifests in that department.
Yes another cold winter could be on the cards and im leaning toward it myself but it's just so more complicated than saying that.
Thats why i feel the wheel was a great invention,CYCLES CYCLES CYCLES
And that all it ever will be i feel,bar that odd hiccup.
We're due cooler times ahead and i believe its coming.0 -
An updated version of Carls data,

Its been a long time coming, but this graph is an easier way to appreciate the effect the outer planets have on our Sun. This is the same information Carl used in his now famous graph, but instead of a sine wave we have the absolute power shown in a conventional form. Angular momentum can be measured in different ways leading to confusion. Now we have a reliable power guide directed at the Sun from the Jovian planets.
Source: Carl’s JPL data assuming 2E+47 as a zero point and inverting all points below.
This next graph shows the sunspot cycle superimposed on the angular momentum strength…showing strong correlations. Notice how after a sudden slowdown the high angular momentum peaks are not fully utilized.
UPDATE 11/05/09:
The same graph but with the solar orbital velocity as it orbits the SSB overlaid. This shows the connection between Angular Momentum and the fluctuating speed of the Sun as it orbits the solar system barycenter, this orbit path being controlled by the outer planets. Conservation of angular momentum has consequences.
Below: This time I have compared the Sun’s velocity with the typical AM graph as per Carl….the altered velocity obvious at 1650, 1830 and 2010 which also correspond with radical Solar path changes caused by the outer planets. The Sun’s orbit speed is surprisingly slow and goes from around 30 km/h up to around 60 km/h (100% increase) when Angular Momentum is at its highest. This still allows the Sun to move over 1.5 million km from the SSB over 5 years. Note when the two lines diverge there is a corresponding slow down in solar activity.
This graph showing the velocity of the Sun is a product of Angular Momentum (red line = velocity). Interestingly velocity can exceed AM and also not use the full potential of AM. A conservation is required? Is there another force involved that modulates the usage of AM?
Now the question is, are there any other consequences, is the changing velocity also changing the rotation speed of the Sun as well. I have been searching for solar rotation rates but it seems we are unable to record this presently, there are no fixed points on the surface of the Sun which has a highly movable outer layer. The idea of a solar rotation change due to the planets is highly speculative, but until we can get an accurate measurement of solar rotation it cant be ruled out. If we could record the solar rotation accurately this discussion would be over…but we CAN record the rotation rate of Earth, and I postulate on the following with some brain food…… The Earth’s rotation rate is calculated by recording the Length of Day which shows our longest days (slower speed) are always in January. Theories suggest this is because of weather patterns that always occur in January but it also coincides with our planets fastest velocity which shows a very regular pattern each January.
Interesting pattern similar to the Jovian orbits…expecting earths orbit to follow the same trend.
Length of day graph from USNO showing the yearly rotation speed pattern of our planet. The slowest days are in January each year, which coincides with our closest approach to the Sun in our slightly elliptical orbit.0 -
Advertisement
-
I know some of you might seem confused now by saying,"well which is it Redsunset,one minute your raving about a blank sun and cosmic rays contributing to past and future climates and now your telling me the big boys in our solar system are actually really controlling matters".
Well i wasn't going to insert that info into this thread but when MT brought it up in another i said what the hell lets explore everything and see what this jigsaw puzzle creates.
So sit back and frazzle your little brains if you wish.Otherwise just look at the cool pics of our glorious Sun.
Ps
All opinions welcome.
Seriously though, i could have picked a less complicated hobby to enjoy,but its like a drug.0 -
Another spotless day.Sunspot number: 0
What is the sunspot number?
Updated 20 Aug 2010
Spotless Days
Current Stretch: 1 day
2010 total: 36 days (16%)
2009 total: 260 days (71%)
Since 2004: 803 days
Typical Solar Min: 486 days0 -
DAMN!!!

Spaceweather site still showing a blank sun so needs to be updated according to this chart.
EDIT; Spaceweather not counting that spot.Thats fine by me.
It's probably not large enough to be counted0 -
Hit the snooze button.
") Sunspot number: 0
Sunspot number: 0
What is the sunspot number?
Updated 22 Aug 2010
Spotless Days
Current Stretch: 3 days
2010 total: 38 days (16%)
2009 total: 260 days (71%)
Since 2004: 806 days
Typical Solar Min: 486 days0 -
Letter to the Director of SIDC
August 23, 2010
SIDC know the institution as prestigious and well known worldwide for determining official sunspot number ( NS) , daily and monthly .
Precisely for this reason , are writing to express our surprise and our doubts about the criteria for calculating the SN and respect the values that we read every day, compared with what we see from SOHO Continuum : for example, SN = 4 given , August 20 , a sun sincerely there appeared no stains, or the SN = 33 days of August 16 , with a Sun where little micromacchie .
We would be very useful for us and for all lovers of the subject, if you could give us some information about
1) the criteria for calculating the sunspot number, in particular the correction factor (K ) used ;
2) the names of the observers whose data were used to calculate the sunspot number, as well as Catania and Locarno;
3) the criteria for calculating the sunspot number in the presence of " steam "or whether or not the same as for the sunspots ;
4) Finally , how is possible to compare the sunspot number calculated by the SIDC recently ( during the last and least during the current cycle 24) with the calculated SN 50, 100, 200 years ago and intends to proceed with the SIDC such comparisons in the near future : it is a well known problem of continuity of the calculation of SN modern than the past, due to the increased resolution of the instruments used for observation of sunspots.
We believe that an official response on his part to further increase the prestige of the SIDC . For this , we thank you in advance for your response that will provide us and to all other lovers of this beautiful science.
Sincerely
SIDC is a worldwide well known and prestigious organization, for official daily and monthly sunspot number ( SN ) calculation .
For this reason we wish to express surprise and Our Doubts about SN SN calculation criteria and values we can read about Every Day , Compared with SOHO Continuum observation : g on August 20th SN = 4 But The Sun seemed to be absolutely spotless , or August 16th , SN = 33 But the visible solar surface just HAD Few microsunspots .
We Believe It Would Be Very useful , for us and for many other amateurs , if You Could Give Some information about
1) SN calculation criteria , Including the correction factor ( K) used ;
2) the names of the Observatories Whose data are used to calculate SNS, together with Those coming from Catania and Locarno;
3) When SN calculation criteria " pores " are visible , ie If They Are the Same as Those Used for sunspots ;
4) last but not least, how to appear SIDC recent SNS ( During the last minimum and During the current cycle 24) Calculated with SNS 50, 100 , 200 years ago and , furthermore , if the SIDC is going to proceed with Such a comparison in the future: in fact , it is well known the problem of continuity of modern calculations SNS Compared to past ones , two to higher resolution of the instruments used for Sunspot observation .
We Believe That an official answer from You Could INCREASE SIDC high reputation . For this reason , we wish to thank you in advance for the answer you will be going to give us and to all the other amateurs of this Fascinating science .
Best Regards.
SIDC 's response to the letter
published August 23
August 24, 2010
First , thanks for your deep interest in the " Sunspot index ( sunspot number, SN )).
Let me give short answer to your questions.
Find additional information in Annex I published very recently.
"Precisely for this reason , are writing to express our surprise and our doubts about the criteria for calculating the SN and respect the values that we read every day, compared with what we see from SOHO Continuum : for example, SN = 4 given , August 20 , a sun sincerely there appeared no stains, or the SN = 33 days of August 16 , with a Sun where little micromacchie .
Please note that the MDI instrument has a relatively limited spatial resolution ( 1Kx1K CCD), and lost many small spots that are easily detected by visual observation with a small amateur telescope . Thus, although functioning in space , MDI is not a good reference for counting the spots.
Here in Brussels for our daily activities , mainly used images collected from the ground of our stations ( uset , Uccle ) or Kanzelhöhe or Catania , but the images and SOHO MDI images . Remember too, that capture visual observation spots in a different way than the CCD ( Charge Coupled Device - electronic light detector ) .
Until recently , the visual observations was better than the CCD image .
Only with the recent CCD , higher resolution of 4 megapixels and techniques in real-time image selection , it became possible match and sometimes exceed the visual observations.
In space, the images from the new missions SDO and PICARD , launched very recently , will be among the best available in the years to come.
"We believe it would be very useful for us and for all lovers of the subject, if you could give us some information about
1) the criteria for calculating the sunspot number, in particular the correction factor (K ) used ; "
Although I do not understand what you mean by that criteria , let me explain the whole process schematically : the index Ri is based on global statistics on a network of 80 stations distributed around the world.
The index is usually the simple average of all daily Wolf numbers from all the stations .
The dispersion of these values is plotted ( standard deviation) and outlier (values far from the mean) isolates ( errors, poor observation) are detected and discarded efficiently because we can count on a typical 40- independent values each day.
Each station is plotted over time individually and the average ratio between the station and the entire network of stations is computed each month , giving the coefficient K scale of the station. This coefficient takes into account the different instruments and observing conditions of the observers , as well as seasonal effects ( monthly values of K ) . Any deviation of a station can be readily identified , so the deviation does not affect many or all network stations .
A further protection against secular deviations is to use a station pilot , currently Locarno ( base station of the original network of Zurich) .
The Ri network is compared with the value of Locarno , which benefits from a constant term ( the same instrument , same site and also the same observer over the last 50 years ) . Again , any deviation that affects the network or station of Locarno will not be the same for both and lead to a discrepancy . However, this has never been detected.
Finally, note that the value Ri result is multiplied by a constant factor 0.6. This value was applied to Zurich for recent values of Re , to lead them back to the same scale compared to previous values , by Rudolph Wolf. This is an agreement that prevented the complete recalculation of previous values ( a long and boring back in the 19th century).
Like that when we observe a single spot (Wolf = 11), do not be surprised to see that Ri is instead of 7 .
2) the names of the observers whose data were used to calculate the sunspot number, as well as Catania and Locarno;
At this moment I have with me the list of observers, but remember that they are approximately 80 ( 1 / 3 professional and 2 / 3 amateur ) worldwide.
Thus , each individual station can not itself constitute ' a big difference and divert Ri in case of error . In addition, the observation stations must qualify before being included in the computation of Ri . First, we require that you provide values for more than 30 % of days each month and systematically (not occasional untrained observers are accepted ) . We assess the stability of the station compared to the entire network for a whole year before the station is incorporated in the calculation of Ri .
3) the criteria for calculating the sunspot number in the presence of " steam "or whether or not the same as for the sunspots ;
The definitions of " steam "vary even among different scholars. Counting of Ri, we must be consistent with the observations of the distant past and thus, the criterion " Sunspot - pore "is regarded as purely empirical and dependent on the acuity and perception of each observer
This border variable , linked primarily to the resolution, is thus translated in the coefficient K for each station ( scale) and daily loss of all stations (noise ) .
Note that many other factors play a role in this dispersion. For example, small spots or steam always have a short , amounting to a few hours. Once each station makes its observations in a different time interval of 24 hours (Re is thus a time average over 24 hours ) , some stations will see a spot while others will see it and so are both correct !
4) Finally , how is possible to compare the sunspot number calculated by the SIDC recently ( during the last and least during the current cycle 24) with the calculated SN 50, 100, 200 years ago and intends to proceed with the SIDC such comparisons in the near future : it is a well known problem of continuity of the calculation of SN modern than the past, due to the increased resolution of the instruments used for observation of sunspots.
Really, when you consider comments before the 19th century , the scale is less accurate ( less advanced tools but also more rare comments by observers less ) , on the other hand , in the last 125 years , the index of the spots is quite well validated (several other series of solar observations allow to check every deviation , many observers simultaneous)
The search continues in that field and historical data are restored and help improve the reconstructions past (maybe here refers to the reconstruction of sunspot number before 1849)
A good example is the number of sunspot group ( Group Sunspot Number) provided by Hoyt and Schatten , that ensures good stability , 5% of Ri on the last 125 years ,
that grows to a maximum of 25% going further back in time.
This is because , for centuries past , in addition to Ri, many scholars now use the group number , the more primitive but more stable, integrated by the ( more indirect ) index aa index of geomagnetic activity .
We believe that an official response on his part to further increase the prestige of the SIDC . For this , we thank you in advance for your response that will provide us and to all other lovers of this beautiful science.
Well ! This is our response
The attached document , which is a call for an international meeting , already provides a fair and complete view of heredity and methods relating to the Ri, but space was limited on the page . So much of this information will place on our website in the future.0 -
interesting pic

Big Bear's Sunspot
Image courtesy BBSO/NJIT
This crisp view of a sunspot, captured by New Jersey Institute of Technology's New Solar Telescope and released last week, may be the most detailed picture of its kind yet shot in visible light, astronomers say.
The 5.25-foot (1.6-meter) telescope, which became operational last year, sits at the school's Big Bear Solar Observatory in the San Bernardino Mountains of California. The device uses a special deformable mirror—part of what's called an adaptive optics system—to compensate for atmospheric distortions and produce ground-based images with about the same clarity as shots from orbiting observatories, experts say.
(See the sharpest picture of Jupiter yet taken from Earth.)
High-resolution sunspot pictures in many types of light help scientists better understand solar storms and space weather, which can disrupt navigation and communication systems on Earth and expose people in spacecraft or airplanes to potentially harmful radiation. (Read "Magnetic-Shield Cracks Found; Big Solar Storms Expected.")
"With visible light, we can see very detailed structures on the sun's surface," said William Dean Pesnell, project scientist for NASA's Solar Dynamics Observatory.
—Brian Handwerk
Published August 30, 20100 -
Over in the dreaded "other thread" I just posted a new table that was not in the linked research on the NW site. This one shows that solar activity over the long period has varied with Jupiter's orbital position. The main finding is that there are conspicuous weaknesses in solar activity (on a statistical basis) twice in the 12-year orbital cycle when the earth is furthest away from the orbital plane of Jupiter. The drop off in activity is quite sharp and with such a long data series would seem to be non-random. I think this matches other findings quoted in papers that were suggested by readers of the NW thread.
This basically underscores my contention that solar variation is driven by the three factors acting in some sort of unified complex way, first of all, a large component created by Jupiter and Saturn interacting (through their field sectors), secondly, a background second-order 6-year double harmonic (with period 11.86 yrs) based on Jupiter's inclination, and third, as I discovered independently of the cited research in this thread, a dampening effect by Uranus and Neptune (or some other cause that has a very similar period to their orbital cycle of 171 years).
On my home computer, I created a data set which fleshes out the historical sunspot data and makes it conform to the patterns of modern year to year data so that peaks of given intensity have the same shape -- there is no way to prove this actually is the case, but it must be a close approximation. Using that data, I found all sorts of slight cycles based on any pair of solar system objects, for example, Jupter/Uranus, Saturn/Uranus etc. The modulations are fairly consistent with a sort of mass over distance squared approach scaled to the biggest cycle of Jupiter and Saturn. When you get down to Saturn/Uranus, the cycle is 44 years long and it has about 3% the amplitude of the solar cycle in general. Even something like Mars-Jupiter leaves an imprint in the data. There may also be some unknown resonance effects with the J-field sectors caused by asteroids which may point to some sort of electromagnetic source for these disturbances at a critical focal length. Possibly the J-fields go through constricted points in that orbital distance range and invert (a laser effect may be theorized). Jupiter and Saturn have opposite magnetic polarity and this may have something to do with the Hale cycle of alternating sunspot polarity. (alignment maxes one polarity, opposite side maxes the other).
On a much more mundane level, solar flares seem to peak when Mercury is in alignment with a planetary field sector, and Mercury has just whizzed past the earth on the inside track, and in the next 2-3 days will move through the J-2 field (the first of two J-field sectors connecting Jupiter with the Sun, the other one which I call J-1 will be traversed around late September and is arced well ahead of Jupiter through the space we will be reaching in November). I expect there may be some major flare activity with these two passages.0 -
-
It's been using too much of this!

 0
0 -
Advertisement
-
One thing I have noticed is that the same clump of spots have been crossing the visible disc for that last two or three solar rotations, so we can expect some "new" spots to come over the horizon in a couple of days.0


![[Deleted User]](/applications/dashboard/design/images/defaulticon.png)


Advertisement