Advertisement
If you have a new account but are having problems posting or verifying your account, please email us on hello@boards.ie for help. Thanks :)
Hello all! Please ensure that you are posting a new thread or question in the appropriate forum. The Feedback forum is overwhelmed with questions that are having to be moved elsewhere. If you need help to verify your account contact hello@boards.ie
Hi all,
Vanilla are planning an update to the site on April 24th (next Wednesday). It is a major PHP8 update which is expected to boost performance across the site. The site will be down from 7pm and it is expected to take about an hour to complete. We appreciate your patience during the update.
Thanks all.

2020 Hurricane Season (Atlantic & East Pacific)

15681011

Comments

  • Registered Users Posts: 8,219 ✭✭✭Gaoth Laidir


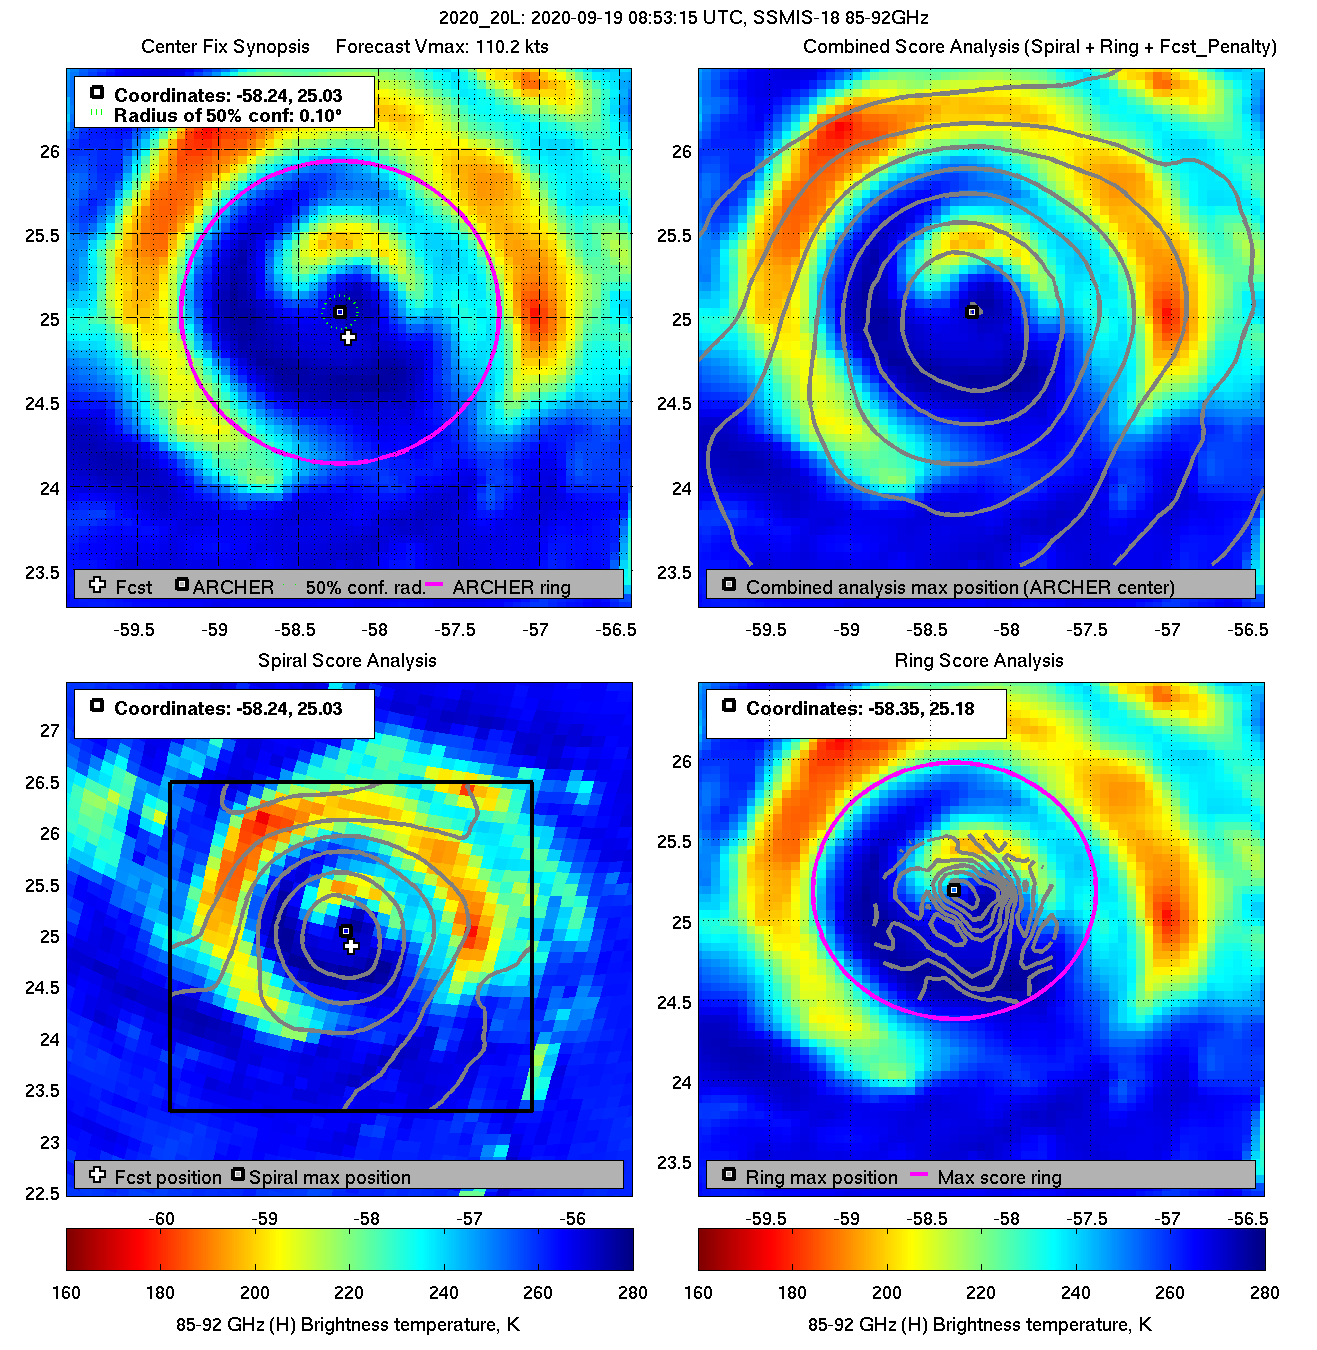
    Teddy has weakened slightly to 110 knots as it goes through an ERC and it should start to slowly weaken overnight as it moves well to the east of Bermuda on Monday and towards Nova Scotia on Wednesday, by which time it should be below hurricane strength and going through extratropical transition.

    06Z SHIPS


    diag20200919T085315_ssmis18_85.png


  • Registered Users Posts: 9,233 ✭✭✭sdanseo


    Looks like Bermuda is going to get very lucky. Teddy's weakening just before it hit was always forecast but now should miss them altogether.

    Meanwhile, poor Louisiana. One state getting whacked a third time in month along with Texas this go.


  • Registered Users Posts: 8,219 ✭✭✭Gaoth Laidir


    Nice chart shows the cold upwelling that the various storms have generated over the past 7 days. Most notable are the tracks of Paulette, which turned northeastwards around Bermuda, with Teddy following roughly the same path up to now. Also just off the New Orleans coast, where Sally moved slowly.

    Tropical cyclones are efficient heat-transfer machines, from the water to the atmosphere and then out to space.

    526878.png


  • Registered Users Posts: 8,219 ✭✭✭Gaoth Laidir


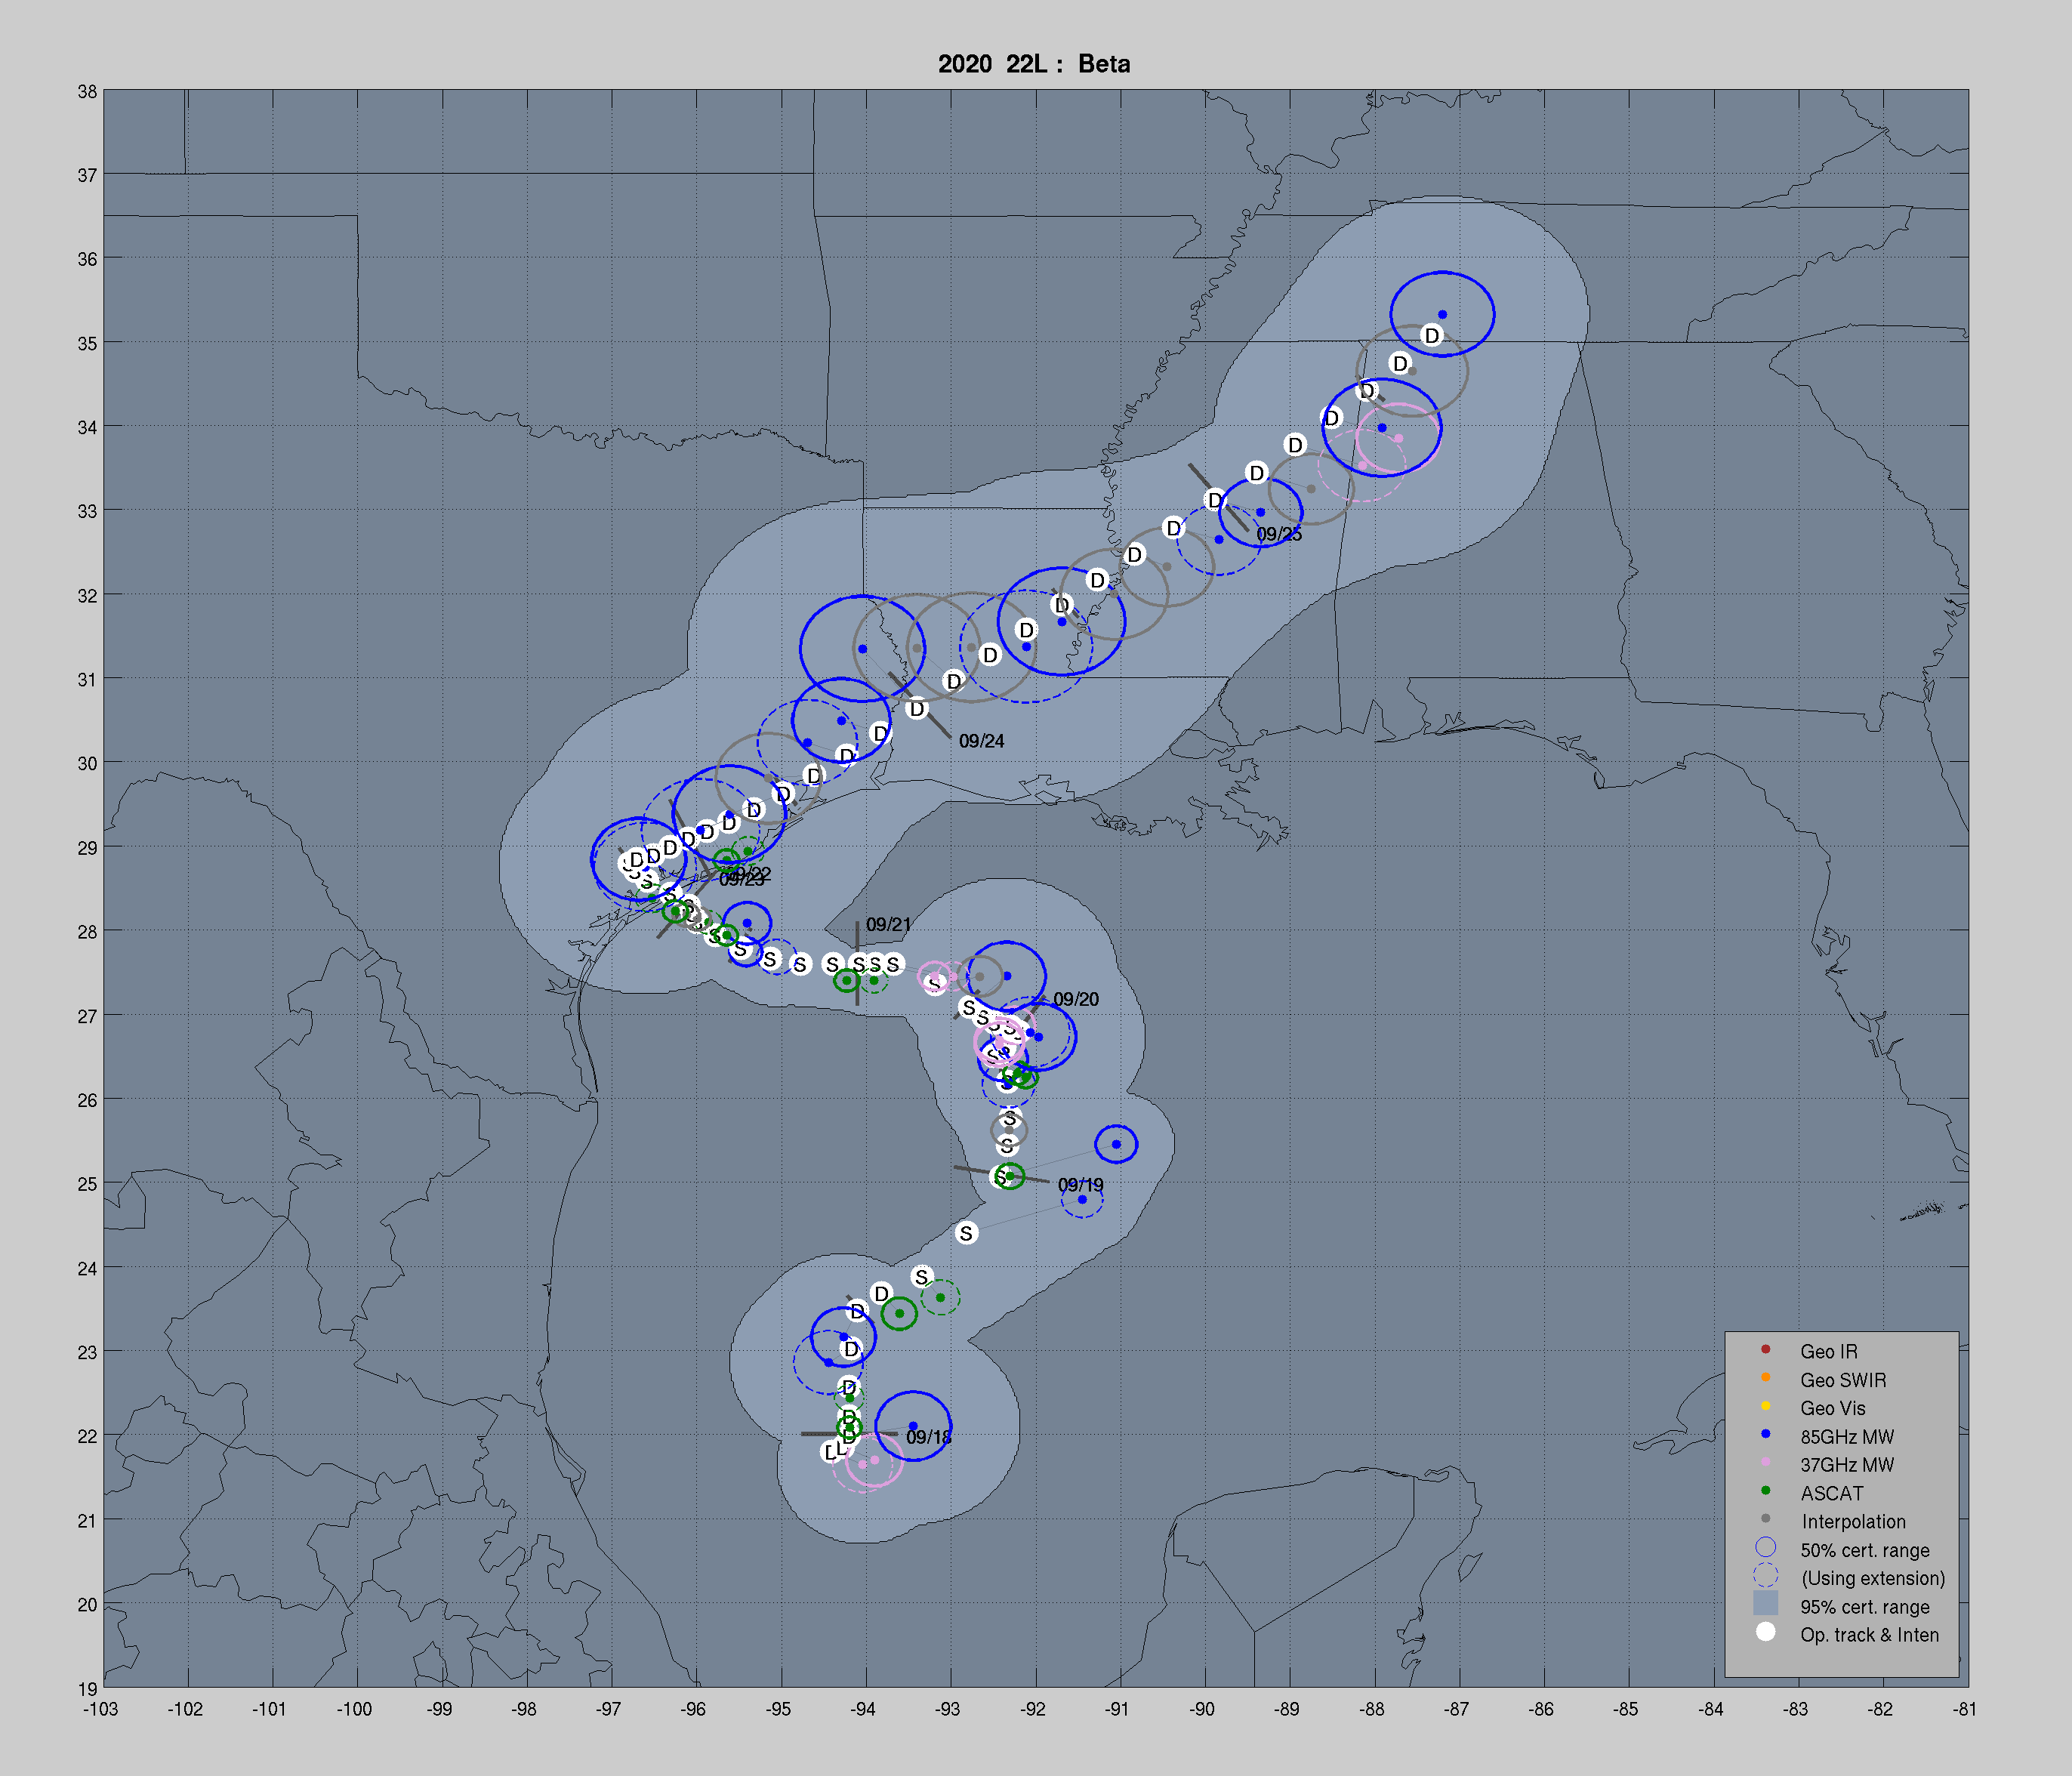
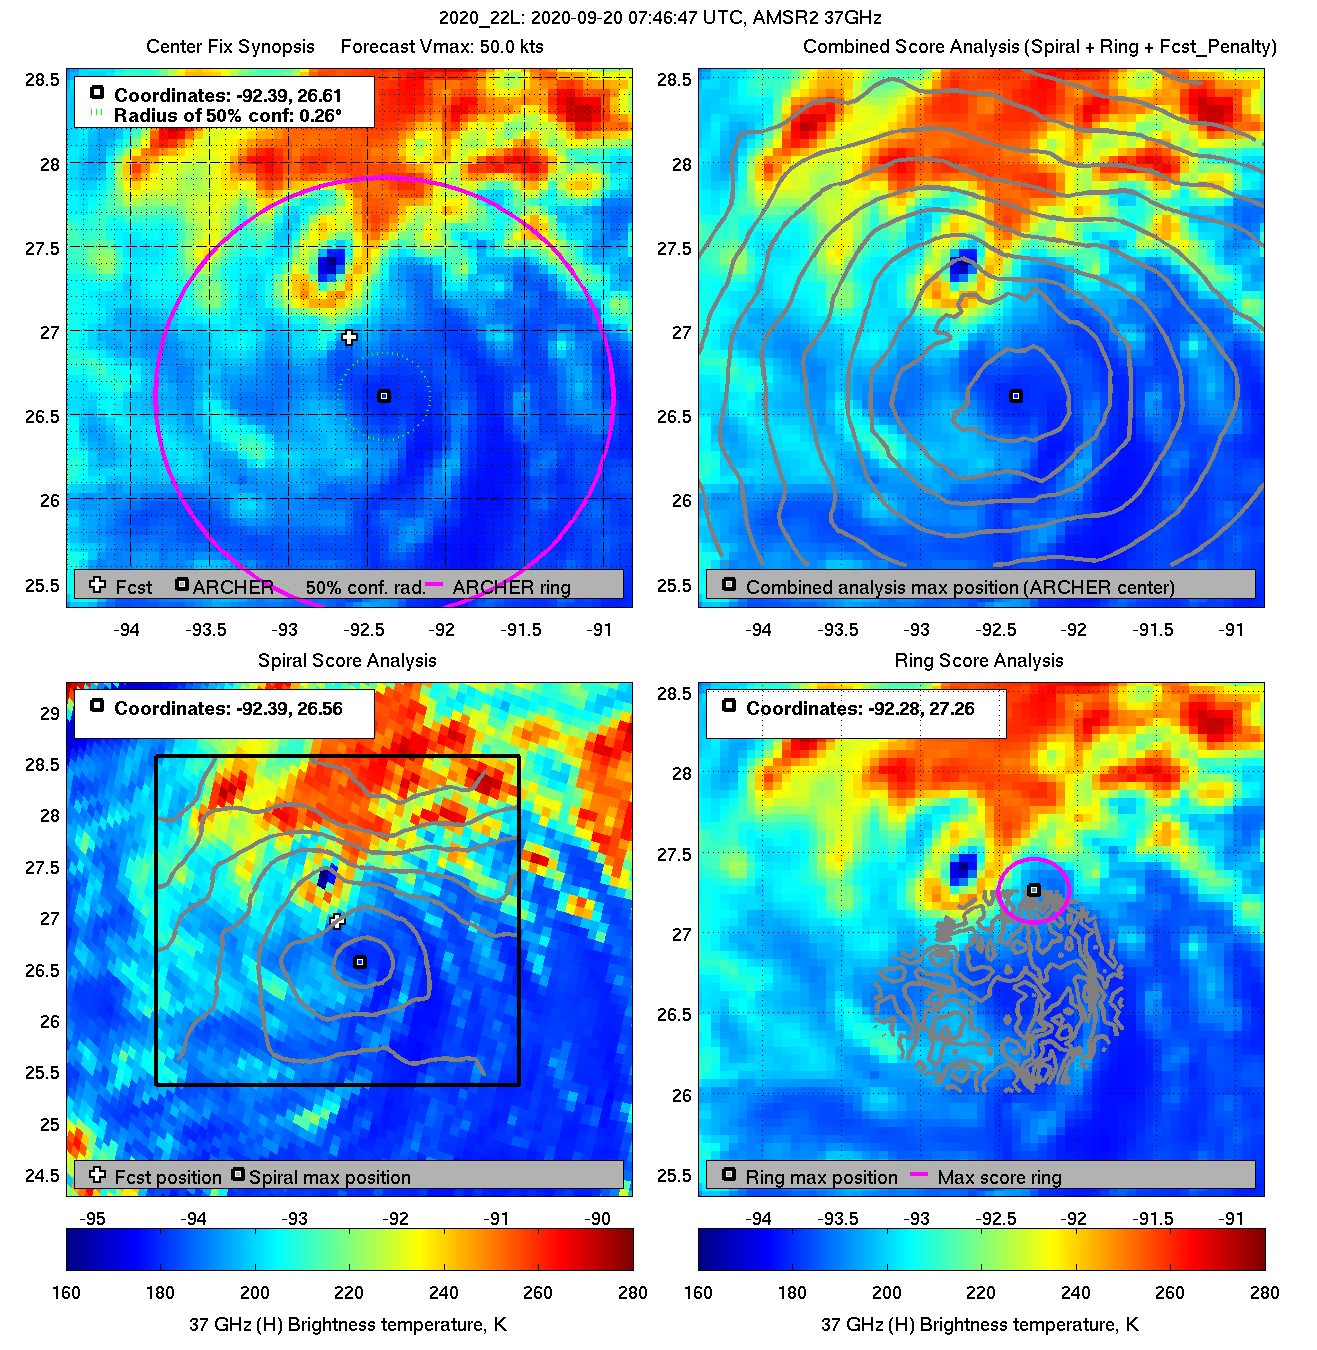
    Tropical Storm Beta is southeast of Galveston now and will slowly move northwestwards towards the mid-Texas coast, landfalling somewhere around Port O'Connor as a50-knot TS late tomorrow. Its structure has diminished due to shear and dry air wrapping around from the west, and the 50-knot winds are actually along a cold frontal zone well to the northeast of the centre.

    Live centre fixes map
    track.png

    Latest 37 GHz
    diag20200920T074645_amsr2_37.png


  • Registered Users Posts: 8,219 ✭✭✭Gaoth Laidir


    Teddy is now 100 knots and feeling effects of shear and dry air. It will continue to slowly weaken as it passes east of Bermuda early tomorrow and then accelerate towards Nova Scotia and New Foundland, becoming extratropical as it does so.

    526894.png

    202020L_wind_ssmis.gif


  • Advertisement
  • Registered Users Posts: 8,219 ✭✭✭Gaoth Laidir


    The latest aircraft recon into Teddy has only found max SFMR winds of 73 knots, max fligh level winds of 88 knots.
    355
    URNT12 KNHC 201050
    VORTEX DATA MESSAGE AL202020
    A. 20/10:33:20Z
    B. 27.92 deg N 062.51 deg W
    C. 700 mb 2784 m
    D. 964 mb
    E. 200 deg 3 kt
    F. OPEN SW
    G. C40
    H. 55 kt
    I. 224 deg 23 nm 10:26:30Z
    J. 329 deg 70 kt
    K. 231 deg 33 nm 10:23:30Z
    L. 73 kt
    M. 047 deg 28 nm 10:42:00Z

    N. 138 deg 88 kt
    O. 047 deg 34 nm 10:43:30Z

    P. 11 C / 3049 m
    Q. 16 C / 3051 m
    R. 13 C / NA
    S. 12345 / 7
    T. 0.02 / 2 nm
    U. AF307 0520A TEDDY OB 05
    MAX FL WIND 88 KT 047 / 34 NM 10:43:30Z

    Live recon chart
    recon_AF307-0520A-TEDDY_timeseries.png

    recon_AF307-0520A-TEDDY.png


  • Registered Users Posts: 17,797 ✭✭✭✭hatrickpatrick


    Nova Scotia seems to have dodged a bullet, it was looking a lot stronger as it made landfall there just a couple of days ago model-wise


  • Registered Users Posts: 8,219 ✭✭✭Gaoth Laidir


    Nova Scotia seems to have dodged a bullet, it was looking a lot stronger as it made landfall there just a couple of days ago model-wise

    The NHC were consistently going on the top end or above the model guidance (with the exception of the NGVI, which for some reason has gone bonkers on the intensities this year and seems to be always an upper outlier). Teddy managed to get it together for a little while but again, like pretty much all the other systems this year (bar Laura), it struggled with shear or dry air for a lot of the time.

    Of the 23 named systems this season only nine have reached intensities above 50 knots, and of these only two got above 100 knots (Teddy, 120 kt and Laura, 130 kt). The current stats of Named storms/Hurricanes/Major hurricanes/Total ACE stand at 23/8/2/99.4, compared to the 1981-2010 average for this point in the season of 8.0/3.9/1.9/70.1.

    We should see a quiet period set in now as the MJO is weak and in Phase 4 and a Kelvin wave suppresses Atlantic convection. With Beta about to make landfall as a weak tropical storm tonight 2020 will tie with 1916 for the highest number of landfalling systems in one season (9). With all that we're hearing it's amazing to hear that we were seeing similar activity back over 100 years ago. Will CNN report that, I wonder?

    https://twitter.com/philklotzbach/status/1308014269670203394


  • Registered Users Posts: 8,219 ✭✭✭Gaoth Laidir


    Beta is just making landfall along the mid-Texas coast but there's no real structure to it on radar. Max surface wind reports in the 20-25-knot range.

    It should just make it inland before moving northeastwards along the coast over the next couple of days.

    Wind gusts (red) below are in mph.

    527047.JPG


  • Registered Users Posts: 17,797 ✭✭✭✭hatrickpatrick


    2020 will tie with 1916 for the highest number of landfalling systems in one season (9). With all that we're hearing it's amazing to hear that we were seeing similar activity back over 100 years ago. Will CNN report that, I wonder?

    Slightly off-topic, but I will forever be fascinated and mystified by the 1933 Atlantic Season, which actually surpassed 2005 in terms of ACE and in my opinion almost certainly had far more name-worthy storms than its official tally, given that it occurred before satellites and therefore would have missed a huge number of recurving fish storms.

    I would love to get my hands on the kind of teleconnection data we have access to now (global SST anomalies, SAL analyses, wind shear etc) to compare the 1933 season with 2005, 2017 and 2020, as I'm very much convinced that there are as-yet undiscovered teleconnections which make hurricane seasons more or less active, beyond the well known markers such as ENSO, PDO, AMO, IOD etc.

    2005, for example, did not feature a La Nina event but featured a prolonged period of severely curtailed convection in the Central Pacific, almost like a season-long standing wave of subsidence and an equivalent standing wave of enhancement over the Atlantic. None of the obvious teleconnections account for what might cause these conditions and obviously for 1933 there just isn't enough data, but it raises the possibility that there are other processes involved which we don't understand yet, and I for one can't get enough of that kind of thing :D

    EDIT: To give one simple example: Do we know what caused the African Easterly Jet to slow to a crawl during peak season, such that tropical waves got stuck in the East Atlantic and moved far too slowly to develop? And could this have been predicted ahead of time? It seems to have caught every forecasting agency and meteorologist off guard. The wave which became Paulette, for instance, seemed to take forever to actually make it into the Atlantic after the NHC tagged it as an invest inland over Africa and even then it crawled along for the first few days.


  • Advertisement
  • Registered Users Posts: 8,219 ✭✭✭Gaoth Laidir


    Slightly off-topic, but I will forever be fascinated and mystified by the 1933 Atlantic Season, which actually surpassed 2005 in terms of ACE and in my opinion almost certainly had far more name-worthy storms than its official tally, given that it occurred before satellites and therefore would have missed a huge number of recurving fish storms.

    I would love to get my hands on the kind of teleconnection data we have access to now (global SST anomalies, SAL analyses, wind shear etc) to compare the 1933 season with 2005, 2017 and 2020, as I'm very much convinced that there are as-yet undiscovered teleconnections which make hurricane seasons more or less active, beyond the well known markers such as ENSO, PDO, AMO, IOD etc.

    2005, for example, did not feature a La Nina event but featured a prolonged period of severely curtailed convection in the Central Pacific, almost like a season-long standing wave of subsidence and an equivalent standing wave of enhancement over the Atlantic. None of the obvious teleconnections account for what might cause these conditions and obviously for 1933 there just isn't enough data, but it raises the possibility that there are other processes involved which we don't understand yet, and I for one can't get enough of that kind of thing :D

    EDIT: To give one simple example: Do we know what caused the African Easterly Jet to slow to a crawl during peak season, such that tropical waves got stuck in the East Atlantic and moved far too slowly to develop? And could this have been predicted ahead of time? It seems to have caught every forecasting agency and meteorologist off guard. The wave which became Paulette, for instance, seemed to take forever to actually make it into the Atlantic after the NHC tagged it as an invest inland over Africa and even then it crawled along for the first few days.

    Totally agree. Many other years make the top 10 when you look at ACE and Major Hurricanes. There will most certainly have been many systems missed, and yet the number of recorded systems is still very close to years in the satellite era. Below is list sorted by Major Hurricane Days, but it's a similar picture sorted by several other parameters too, with 1893, 1926, 1950, 1961, etc. also making the top 10.

    All we know is that there is so much that we still don't know.

    http://tropical.atmos.colostate.edu/Realtime/index.php?arch&loc=northatlantic

    527336.JPG


  • Registered Users Posts: 8,219 ✭✭✭Gaoth Laidir


    The Atlantic has gone dead quiet now, with no systems currently active or expected in at least the next 5 days. This is most likely due to the combination of the Phase 4 MJO and a CC Kelvin wave suppressing convection in the Atlantic basin.

    Here are the global stats as they stand. The active Atlantic has had 23 named storms, but only 9 of which made it above 50 knots and only two above 100 knots. Still a very low percentage of major hurricanes. Elsewhere, it's been a very quiet Pacific, making the northern hemisphere as a whole only 68% of the average ACE for this point of the season.

    The combination of the negative Indian Ocean Dipole and La Nina should bring an early start to what should be an active Australian rainy season, so we could see the southeastern Indian Ocean and SW Pacific perk up in a few months.

    527340.JPG


  • Registered Users Posts: 8,219 ✭✭✭Gaoth Laidir


    TD Twenty Five has formed in the Caribbean.
    Tropical Depression Twenty-Five Discussion Number 1
    NWS National Hurricane Center Miami FL AL252020
    1100 AM EDT Fri Oct 02 2020

    Visible satellite images show that cloudiness and showers associated with the low pressure area over the northwestern Caribbean Sea have
    become significantly better organized since yesterday, with convective banding features becoming prominent. Moreover, low cloud
    motions suggest that a closed circulation has become better defined. Therefore, advisories are being initiated on Tropical Depression
    Twenty-Five at this time. The initial intensity estimate is 30 kt based on Dvorak T-numbers, but an Air Force Reserve Hurricane Hunter
    aircraft is scheduled to investigate the system later today to provide a better intensity estimate. Sea surface temperatures are
    very warm, near 30 deg C, and vertical shear should remain low for at least the next couple of days, so the cyclone is likely to become
    a tropical storm by the time it nears the Yucatan Peninsula tomorrow. The main impediment to strengthening over the next few
    days should be the interaction with land. Given the uncertainties about how far offshore the center will be over the next several
    days, the official intensity forecast is conservative.

    Since there is still a lot of scatter in the center fixes, the initial motion estimate, 315/8 kt, is rather uncertain. For the
    next couple of days, the system is expected to move northwestward to north-northwestward on the southwestern edge of a mid-level high
    pressure area. This would take the center near or over the northeastern Yucatan Peninsula. After about 48 hours, the steering
    currents are not well-defined and there is considerable spread in the track models. At this time, it appears the cyclone should move
    slowly westward over the latter part of the forecast period in response to weak ridging over the north-central Gulf of Mexico. The
    official forecast is near or a little north of the corrected and simple model consensus predictions.

    Tropical Storm Warnings and Watches have been issued for a portion
    of the Yucatan Peninsula.

    KEY MESSAGES:

    1. The system is expected to produce heavy rainfall that could result in life-threatening flash flooding over portions of the
    Yucatan Peninsula, far western Cuba and well away from the center in the Mexican states of Campeche, Tabasco, and northern Chiapas.

    2. The depression is forecast to become a tropical storm and bring tropical storm conditions to portions of the Yucatan Peninsula on
    Saturday, where a Tropical Storm Warning is in effect.

    FORECAST POSITIONS AND MAX WINDS

    INIT 02/1500Z 18.1N 84.7W 30 KT 35 MPH
    12H 03/0000Z 18.9N 85.6W 30 KT 35 MPH
    24H 03/1200Z 19.8N 86.6W 35 KT 40 MPH
    36H 04/0000Z 20.6N 87.2W 40 KT 45 MPH...INLAND
    48H 04/1200Z 21.4N 87.5W 40 KT 45 MPH...INLAND
    60H 05/0000Z 22.0N 87.6W 40 KT 45 MPH
    72H 05/1200Z 22.0N 88.2W 45 KT 50 MPH
    96H 06/1200Z 21.5N 90.5W 45 KT 50 MPH
    120H 07/1200Z 21.5N 92.5W 45 KT 50 MPH

    aal91_2020100212_track_early.png

    aal91_2020100212_intensity_early.png


  • Registered Users Posts: 8,219 ✭✭✭Gaoth Laidir


    Twenty Five has just become Tropical Storm Gamma.
    ULLETIN
    Tropical Storm Gamma Intermediate Advisory Number 2A
    NWS National Hurricane Center Miami FL AL252020
    700 PM CDT Fri Oct 02 2020

    ...DEPRESSION BECOMES TROPICAL STORM GAMMA OVER THE NORTHWESTERN
    CARIBBEAN SEA...


    SUMMARY OF 700 PM CDT...0000 UTC...INFORMATION
    LOCATION...18.8N 85.8W
    ABOUT 135 MI...220 KM SSE OF COZUMEL MEXICO
    MAXIMUM SUSTAINED WINDS...40 MPH...65 KM/H
    PRESENT MOVEMENT...NW OR 315 DEGREES AT 9 MPH...15 KM/H
    MINIMUM CENTRAL PRESSURE...1000 MB...29.53 INCHES


  • Registered Users Posts: 9,233 ✭✭✭sdanseo


    92L looking like becoming a TS/Hurricane by midweek. GFS showing peak around 56kt, HWRF 76kt, HMON 102kt. All landfall around New Orleans.

    ECM having none of it so far.

    NHC will initiate advisories at 21Z tonight (35min).


  • Registered Users Posts: 8,219 ✭✭✭Gaoth Laidir


    The NHC are going for 85 knots.
    POTENTIAL TROPICAL CYCLONE TWENTY-SIX FORECAST/ADVISORY NUMBER 1
    NWS NATIONAL HURRICANE CENTER MIAMI FL AL262020
    2100 UTC SUN OCT 04 2020

    CHANGES IN WATCHES AND WARNINGS WITH THIS ADVISORY...

    THE GOVERNMENT OF THE CAYMAN ISLANDS HAS ISSUED A TROPICAL STORM WARNING FOR THE CAYMAN ISLANDS...INCLUDING LITTLE CAYMAN AND CAYMAN BRAC.

    THE GOVERNMENT OF CUBA HAS ISSUED A HURRICANE WATCH FOR THE ISLE OF YOUTH AND THE CUBA PROVINCES OF PINAR DEL RIO AND ARTEMISA. A TROPICAL STORM WATCH HAS BEEN ISSUED FOR THE CUBAN PROVINCE OF LA
    HABANA.

    SUMMARY OF WATCHES AND WARNINGS IN EFFECT...

    A HURRICANE WATCH IS IN EFFECT FOR...
    * CUBAN PROVINCES OF PINAR DEL RIO AND ARTEMISA
    * ISLE OF YOUTH

    A TROPICAL STORM WARNING IS IN EFFECT FOR...
    * CAYMAN ISLANDS INCLUDING LITTLE CAYMAN AND CAYMAN BRAC

    A TROPICAL STORM WATCH IS IN EFFECT FOR...
    * CUBA PROVINCE OF LA HABANA

    A HURRICANE WATCH MEANS THAT HURRICANE CONDITIONS ARE POSSIBLE WITHIN THE WATCH AREA. A WATCH IS TYPICALLY ISSUED 48 HOURS BEFORE THE ANTICIPATED FIRST OCCURRENCE OF TROPICAL-STORM-FORCE WINDS...CONDITIONS THAT MAKE OUTSIDE PREPARATIONS DIFFICULT OR DANGEROUS.

    A TROPICAL STORM WARNING MEANS THAT TROPICAL STORM CONDITIONS ARE EXPECTED SOMEWHERE WITHIN THE WARNING AREA WITHIN 36 HOURS.

    A TROPICAL STORM WATCH MEANS THAT TROPICAL STORM CONDITIONS ARE POSSIBLE WITHIN THE WATCH AREA...GENERALLY WITHIN 48 HOURS.

    POTENTIAL TROP CYCLONE CENTER LOCATED NEAR 16.7N 76.6W AT 04/2100Z POSITION ACCURATE WITHIN 35 NM

    PRESENT MOVEMENT TOWARD THE WEST-NORTHWEST OR 290 DEGREES AT 9 KT

    ESTIMATED MINIMUM CENTRAL PRESSURE 1007 MB
    MAX SUSTAINED WINDS 30 KT WITH GUSTS TO 40 KT.
    WINDS AND SEAS VARY GREATLY IN EACH QUADRANT. RADII IN NAUTICAL
    MILES ARE THE LARGEST RADII EXPECTED ANYWHERE IN THAT QUADRANT.

    REPEAT...CENTER LOCATED NEAR 16.7N 76.6W AT 04/2100Z
    AT 04/1800Z CENTER WAS LOCATED NEAR 16.6N 76.2W

    FORECAST VALID 05/0600Z 17.1N 77.7W
    MAX WIND 30 KT...GUSTS 40 KT.

    FORECAST VALID 05/1800Z 18.0N 79.1W
    MAX WIND 35 KT...GUSTS 45 KT.
    34 KT... 40NE 40SE 0SW 40NW.

    FORECAST VALID 06/0600Z 19.0N 80.5W
    MAX WIND 45 KT...GUSTS 55 KT.
    34 KT... 60NE 60SE 40SW 60NW.

    FORECAST VALID 06/1800Z 21.0N 82.8W
    MAX WIND 60 KT...GUSTS 75 KT.
    50 KT... 30NE 30SE 0SW 30NW.
    34 KT... 70NE 60SE 40SW 70NW.

    FORECAST VALID 07/0600Z 23.1N 85.4W
    MAX WIND 70 KT...GUSTS 85 KT.
    50 KT... 40NE 40SE 20SW 40NW.
    34 KT... 80NE 70SE 50SW 80NW.

    FORECAST VALID 07/1800Z 24.7N 87.9W
    MAX WIND 80 KT...GUSTS 100 KT.
    50 KT... 50NE 40SE 30SW 40NW.
    34 KT...100NE 90SE 60SW 90NW.

    EXTENDED OUTLOOK. NOTE...ERRORS FOR TRACK HAVE AVERAGED NEAR 150 NM ON DAY 4 AND 175 NM ON DAY 5...AND FOR INTENSITY NEAR 15 KT EACH DAY

    OUTLOOK VALID 08/1800Z 26.5N 90.3W
    MAX WIND 85 KT...GUSTS 105 KT.


    OUTLOOK VALID 09/1800Z 28.6N 90.3W
    MAX WIND 85 KT...GUSTS 105 KT.

    REQUEST FOR 3 HOURLY SHIP REPORTS WITHIN 300 MILES OF 16.7N 76.6W

    INTERMEDIATE PUBLIC ADVISORY...WTNT31 KNHC/MIATCPAT1...AT 05/0000Z

    NEXT ADVISORY AT 05/0300Z


  • Registered Users Posts: 5,681 ✭✭✭BumperD


    I'm the path for L92 tomorrow night/tuesday morning. Will post a picture or two if there is anything of merit


  • Registered Users Posts: 14,319 ✭✭✭✭M.T. Cranium


    Delta heads for the delta. Seems about right.


  • Registered Users Posts: 8,219 ✭✭✭Gaoth Laidir


    Delta is currently 60 knots and rapidly intensifying, most likely reaching Cat 3 as it clips the tip of the Yucatán peninsula. It should be passing over ocean heat content of around 200 kJ/cm² and weak shear over the next 24 hours. The 18Z SHIPS has a 95% chance of an increase of 25 knots in the next 24 hours and 63% chance of a 65-knot increase in the next 72 hours.

    It should weaken as it enters the cooler waters and higher shear of the Gulf before making landfall around Louisiana in a few days.
    SHIPS Prob RI for 20kt/ 12hr RI threshold= 51% is 10.2 times climatological mean ( 5.0%)
    SHIPS Prob RI for 25kt/ 24hr RI threshold= 95% is 8.7 times climatological mean (10.9%)
    SHIPS Prob RI for 30kt/ 24hr RI threshold= 69% is 10.0 times climatological mean ( 6.9%)
    SHIPS Prob RI for 35kt/ 24hr RI threshold= 58% is 14.9 times climatological mean ( 3.9%)
    SHIPS Prob RI for 40kt/ 24hr RI threshold= 56% is 22.4 times climatological mean ( 2.5%)
    SHIPS Prob RI for 45kt/ 36hr RI threshold= 87% is 19.0 times climatological mean ( 4.6%)
    SHIPS Prob RI for 55kt/ 48hr RI threshold= 51% is 11.2 times climatological mean ( 4.6%)
    SHIPS Prob RI for 65kt/ 72hr RI threshold= 63% is 12.1 times climatological mean ( 5.2%)

    Matrix of RI probabilities
    RI (kt / h) | 20/12 | 25/24 | 30/24 | 35/24 | 40/24 | 45/36 | 55/48 |65/72
    SHIPS-RII: 50.9% 95.1% 68.7% 58.2% 56.0% 87.3% 51.4% 62.8%
    Logistic: 39.1% 77.2% 64.7% 39.0% 30.3% 54.7% 60.1% 60.6%
    Bayesian: 23.3% 92.2% 70.3% 38.5% 34.2% 70.7% 15.3% 26.6%
    Consensus: 37.8% 88.2% 67.9% 45.2% 40.2% 70.9% 42.3% 50.0%
    DTOPS: 13.0% 70.0% 40.0% 45.0% 2.0% 23.0% 42.0% 1.0%

    528416.png


  • Registered Users Posts: 5,681 ✭✭✭BumperD


    Thankfully, looks like its going to miss well south of my location having tracked way further west today (though I won't be letting the guard down until its gone out of here).

    Government buildings flying the Tropical Storm Warning Flags this evening.


  • Advertisement
  • Registered Users Posts: 20,336 ✭✭✭✭Rikand


    BumperD wrote: »
    Thankfully, looks like its going to miss well south of my location having tracked way further west today (though I won't be letting the guard down until its gone out of here).

    Government buildings flying the Tropical Storm Warning Flags this evening.


  • Registered Users Posts: 17,797 ✭✭✭✭hatrickpatrick


    Jesus Christ. 2020 will forever go down as the year of RI in terms of Atlantic Hurricanes. :eek:

    pxVoXyH.gif

    ...RECENTLY RECEIVED DATA FROM A NOAA HURRICANE HUNTER AIRCRAFT
    INDICATE THAT DELTA HAS RAPIDLY STRENGTHENED INTO A CATEGORY 4
    HURRICANE...

    Data from a NOAA Hurricane Hunter aircraft indicate that Delta is
    continuing to rapidly strengthen. The maximum winds have
    increased to near 130 mph (215 km/h) with higher gusts. This makes
    Delta a category 4 hurricane on the Saffir-Simpson Hurricane Wind
    Scale.


    SUMMARY OF 1120 AM EDT...1520 UTC...INFORMATION

    LOCATION...18.2N 82.7W
    ABOUT 315 MI...510 KM ESE OF COZUMEL MEXICO
    ABOUT 125 MI...200 KM SW OF GRAND CAYMAN
    MAXIMUM SUSTAINED WINDS...130 MPH...215 KM/H
    PRESENT MOVEMENT...WNW OR 300 DEGREES AT 16 MPH...26 KM/H
    MINIMUM CENTRAL PRESSURE...954 MB...28.17 INCHES


  • Registered Users Posts: 8,219 ✭✭✭Gaoth Laidir


    Jesus Christ. 2020 will forever go down as the year of RI in terms of Atlantic Hurricanes. :eek:

    ...RECENTLY RECEIVED DATA FROM A NOAA HURRICANE HUNTER AIRCRAFT
    INDICATE THAT DELTA HAS RAPIDLY STRENGTHENED INTO A CATEGORY 4
    HURRICANE...

    Data from a NOAA Hurricane Hunter aircraft indicate that Delta is
    continuing to rapidly strengthen. The maximum winds have
    increased to near 130 mph (215 km/h) with higher gusts. This makes
    Delta a category 4 hurricane on the Saffir-Simpson Hurricane Wind
    Scale.


    SUMMARY OF 1120 AM EDT...1520 UTC...INFORMATION

    LOCATION...18.2N 82.7W
    ABOUT 315 MI...510 KM ESE OF COZUMEL MEXICO
    ABOUT 125 MI...200 KM SW OF GRAND CAYMAN
    MAXIMUM SUSTAINED WINDS...130 MPH...215 KM/H
    PRESENT MOVEMENT...WNW OR 300 DEGREES AT 16 MPH...26 KM/H
    MINIMUM CENTRAL PRESSURE...954 MB...28.17 INCHES

    Perfect conditions for RI, with the warmest water, weak shear and moist mid-levels helping it strengthen unabated. It still has some warmer water to get across before reaching the Yucatán peninsula, so Cat 5 is a strong possibility.

    528493.png

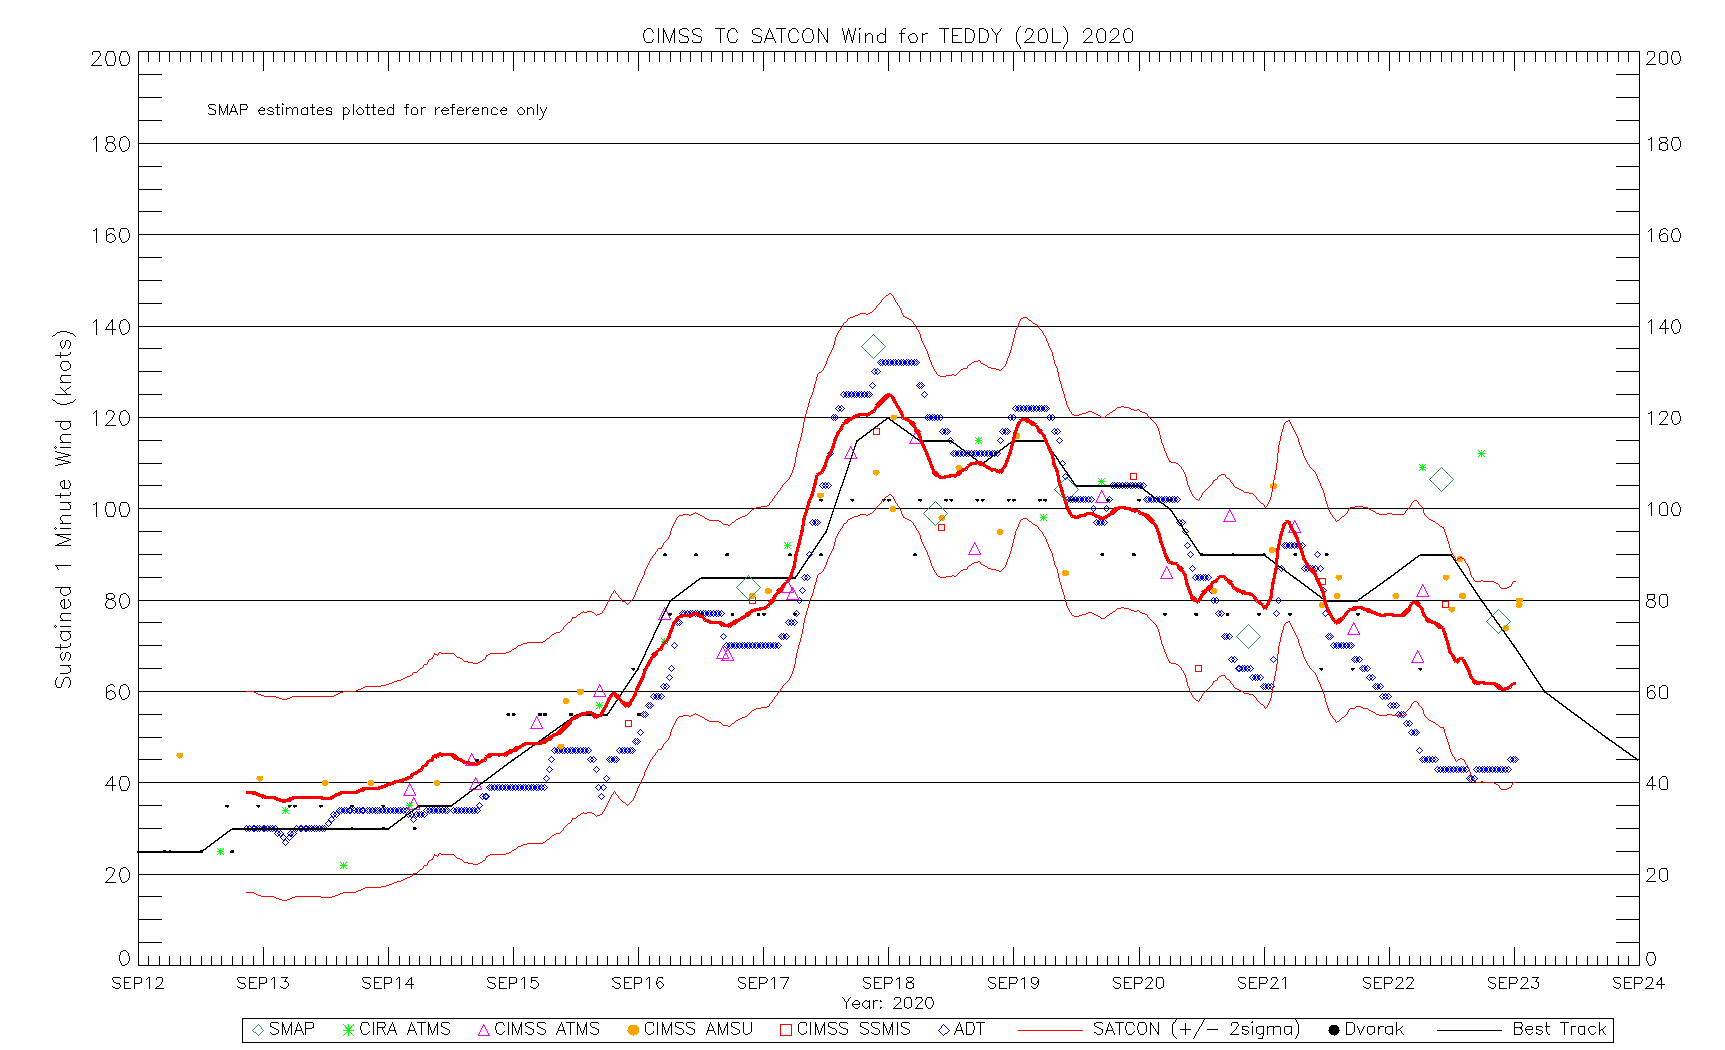
    The current SATCON versus Best Track (grey line) intensity estimates chart shows just how important these frequent high-density aircraft data are in catching these rapid intensifications. How many storms have had similar RI in the past but gone undetected?

    528491.gif


  • Registered Users Posts: 8,219 ✭✭✭Gaoth Laidir


    For reference, as we get late into the season the major ocean heat content becomes more focused back towards the Caribbean. Oh to be snorkeling in the Caymans right now.

    528494.gif


  • Registered Users Posts: 8,219 ✭✭✭Gaoth Laidir


    Latest recon data show much weaker winds in Delta now. Max flight level 98 knots and highest SFMR just 84 knots. The NHC has it at 100 knots.

    As has been a theme this season the satellite appearance has been messy, with no real eye appearing and microwave imagery showing almost zero convection around the northern semicircle.
    454
    URNT12 KWBC 070500
    VORTEX DATA MESSAGE
    AL262020
    A. 07/04:31:31Z
    B. 19.84 deg N 085.38 deg W
    C. 700 MB 2917 m
    D. EXTRAP 968 mb
    E. NA
    F. OPEN NORTH
    G. E13/42/28
    H. 70 kt
    I. 258 deg 4 nm 04:30:30Z
    J. 042 deg 70 kt
    K. 297 deg 15 nm 04:27:35Z
    L. 84 kt
    M. 160 deg 12 nm 04:36:55Z
    N. 252 deg 73 kt
    O. 153 deg 16 nm 04:37:55Z
    P. 12 C / 3066 m
    Q. 23 C / 3065 m
    R. 7 C / NA
    S. 12345 / 7
    T. 0.01 / 2 nm
    U. NOAA3 0626A DELTA OB 36 SLP EXTRAP FROM 700 MB
    MAX FL WIND 98 KT 041 / 22 NM 03:29:59Z


  • Registered Users Posts: 9,233 ✭✭✭sdanseo


    Appears Delta will make landfall in LA as a strong Cat-2:
    FORECAST POSITIONS AND MAX WINDS

    INIT 08/1500Z 24.0N 92.7W 90 KT 105 MPH
    12H 09/0000Z 25.4N 93.6W 95 KT 110 MPH
    24H 09/1200Z 27.5N 93.8W 100 KT 115 MPH
    36H 10/0000Z 29.8N 93.1W 90 KT 105 MPH...ON THE COAST
    48H 10/1200Z 32.4N 91.7W 45 KT 50 MPH...INLAND
    60H 11/0000Z 34.0N 90.0W 30 KT 35 MPH...INLAND
    72H 11/1200Z 35.6N 87.9W 20 KT 25 MPH...POST-TROP/REMNT LOW
    96H 12/1200Z...DISSIPATED


  • Registered Users Posts: 14,319 ✭✭✭✭M.T. Cranium


    Although 2020 has moved into second place for total number of named storms (25), it still ranks 18th (tied with six others) in number of hurricanes (9), and tied 28th (with 27 others) for major hurricanes (3).

    It has set a new mark for named storms that remained only tropical storms (16, previous 13 from 2005 and 12 from several others).

    The 25th named storm came 41 days ahead of 2005's pace (2005 Gamma vs this year's Delta due to added un-named storm in 2005). It is still probably a 50-50 proposition whether we actually get further into the numbers than 2005, but 40-60 that we utilize un-used "Eta" this year.

    With 15 hurricanes 2005 has that record, second place for hurricanes is 12 (1969, 2010).

    The most majors in one season was 7 in 2005, followed by 6 in several years.

    (I have looked at the numbers back to 1851, and discounted the wikipedia entry for 1850 which states 7 hurricanes all of which were major, the actual write-up of the season does not support the latter although it does not entirely refute it).


  • Registered Users Posts: 8,219 ✭✭✭Gaoth Laidir


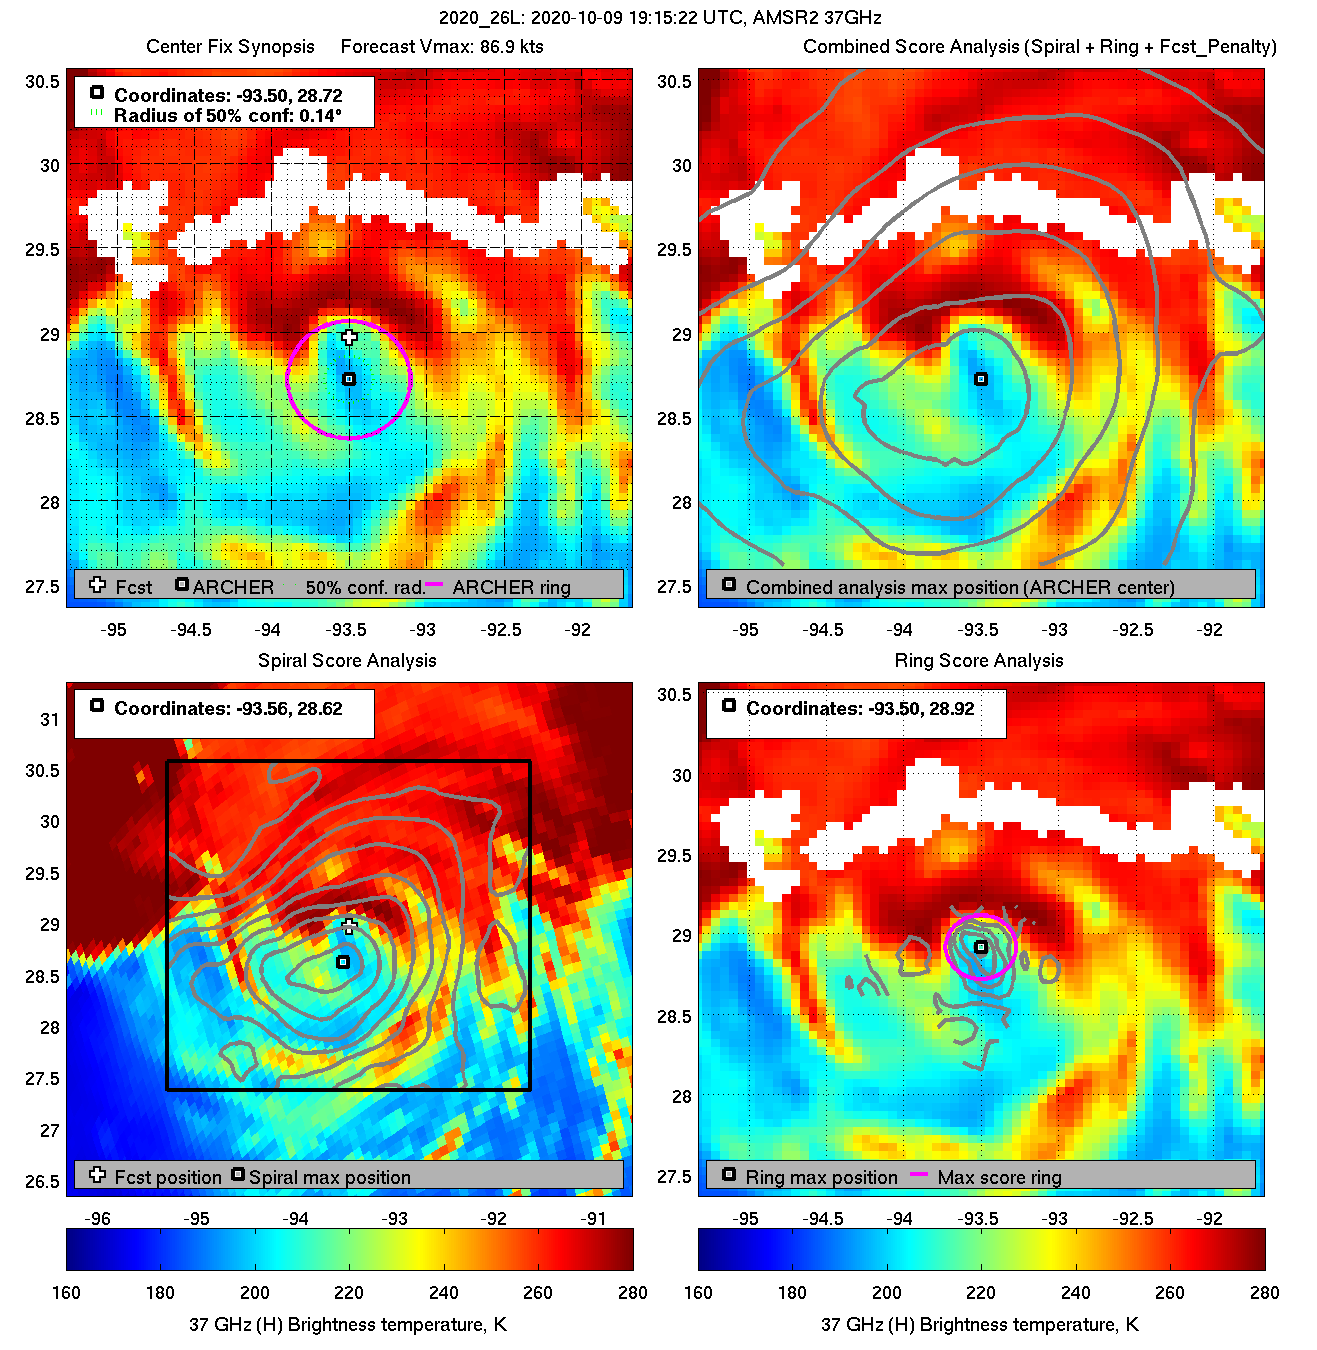
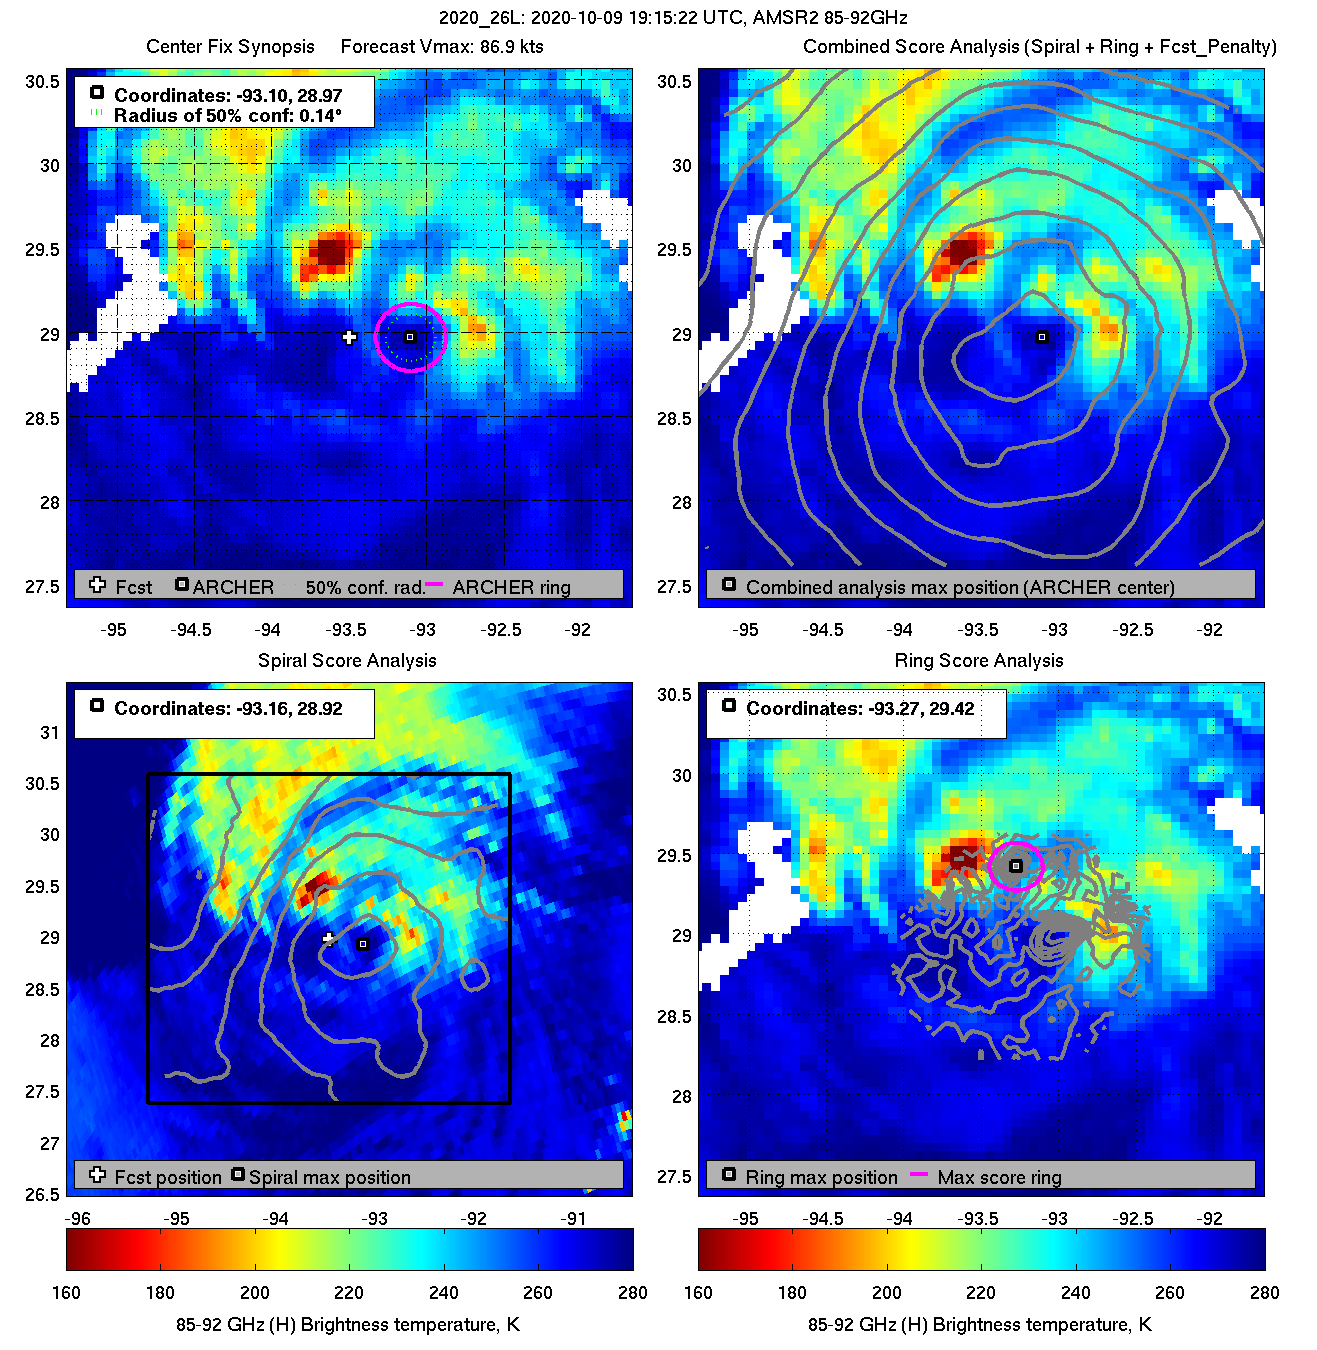
    Hurricane Delta is weakening as it approaches the Louisiana coast now. Down to Cat 2 at 10 pm but likely to be lower at landfall. Surface wind reports are below hurricane-force, though there is a gap in stations to the east of the eyewall landfall point. Gusts are shown in red and in mph.

    Strong shear, dry air and cold water have all led to a complete loss of the southern semicircle convection this evening.

    528821.png

    diag20201009T191521_amsr2_37.png

    diag20201009T191522_amsr2_85.png


  • Registered Users Posts: 8,219 ✭✭✭Gaoth Laidir


    Just making landfall right now.

    528826.PNG


  • Advertisement
  • Registered Users Posts: 8,219 ✭✭✭Gaoth Laidir


    September was a busy month, with a record ten named storms forming. However, hurricanes-wise it was more in line with the long-term average, with 4 hurricanes forming, 1 of which was major. It continues the trend of this season, which has had a high number of named storms (25), but most of which were weak and short-lived, with a relatively low fraction becoming hurricanes (9) and major hurricanes (3).

    September 2020 stats (1981-2010 average in brackets)
    Named storms: 10 (4)
    Hurricanes: 4 (3)
    Major hurricanes: 1 (1)

    2020 season stats up to 13 October (1981-2010 stats for this point in season in brackets)
    Named storms: 25 (10.2)
    Named storm days: 86.75 (49.5)
    Hurricanes: 9 (5.2)
    Hurricane days: 22.75 (20.4)
    Major Hurricanes: 3 (2.4)
    Major Hurricane Days: 5.75 (5.6)
    Total ACE: 123.1 (89.7)
    Monthly Tropical Weather Summary
    NWS National Hurricane Center Miami FL
    800 AM EDT Thu Oct 1 2020

    For the North Atlantic...Caribbean Sea and the Gulf of Mexico:

    Tropical cyclone activity in the Atlantic basin during the month of
    September was very busy and set a record for the most named storms
    forming in a month. Ten named storms formed, with Omar forming from
    a tropical depression that began in late August. Four of the storms
    became hurricanes with one, Hurricane Teddy, reaching major
    hurricane strength. Based on a 30-year climatology (1981-2010),
    four named storms typically form in the basin in September, with
    three of them becoming hurricanes, and one of them becoming a major
    hurricane.

    In terms of Accumulated Cyclone Energy (ACE), which measures the
    strength and duration of tropical storms and hurricanes, activity
    in the basin so far in 2020 has also been above average, about 25
    percent above the long-term mean.

    Reports on individual cyclones, when completed, are available at
    the National Hurricane Center website at
    www.hurricanes.gov/data/tcr/index.php?season=2020&basin=atl

    Summary Table

    Name | Dates | Max Wind (mph)
    TS Arthur | 16-19 May | 60*
    TS Bertha | 27-28 May | 50*
    TS Cristobal | 1-9 Jun | 60
    TS Dolly | 22-24 Jun | 45
    TS Edouard | 4-6 Jul | 45
    TS Fay | 9-11 Jul | 60
    TS Gonzalo | 21-25 Jul | 65
    H Hanna | 23-27 Jul | 90
    H Isaias | 30 Jul- 5 Aug | 85
    TD Ten | 31 Jul- 1 Aug | 35
    TS Josephine | 11-16 Aug | 45
    TS Kyle | 14-16 Aug | 50
    MH Laura | 20-28 Aug | 150
    H Marco | 20-25 Aug | 75
    H Nana | 1-4 Sep | 75
    TS Omar | 31 Aug- 5 Sep | 40
    H Paulette | 7-22 Sep | 105
    TS Rene | 7-14 Sep | 50
    H Sally | 11-17 Sep | 105
    MH Teddy | 12-22 Sep | 140
    TS Vicky | 14-17 Sep | 50
    TS Wilfred | 18-20 Sep | 40
    SS Alpha | 18 Sep | 50
    TS Beta | 17-22 Sep | 60

    * Denotes a storm for which the post-storm analysis is complete.


Advertisement