Advertisement
If you have a new account but are having problems posting or verifying your account, please email us on hello@boards.ie for help. Thanks :)
Hello all! Please ensure that you are posting a new thread or question in the appropriate forum. The Feedback forum is overwhelmed with questions that are having to be moved elsewhere. If you need help to verify your account contact hello@boards.ie
Hi all,
Vanilla are planning an update to the site on April 24th (next Wednesday). It is a major PHP8 update which is expected to boost performance across the site. The site will be down from 7pm and it is expected to take about an hour to complete. We appreciate your patience during the update.
Thanks all.
The sun is dead!! Mini iceage???
Comments
-
http://www.smh.com.au/environment/weather/australias-warmest-end-to-july-in-decades-20110801-1i7be.htmlMuch of central and southern Australia has had its warmest end to July in decades, with the last few days of the month 3 to 8 degrees above average.
Read more: http://www.smh.com.au/environment/weather/australias-warmest-end-to-july-in-decades-20110801-1i7be.html#ixzz1UX7odw000 -
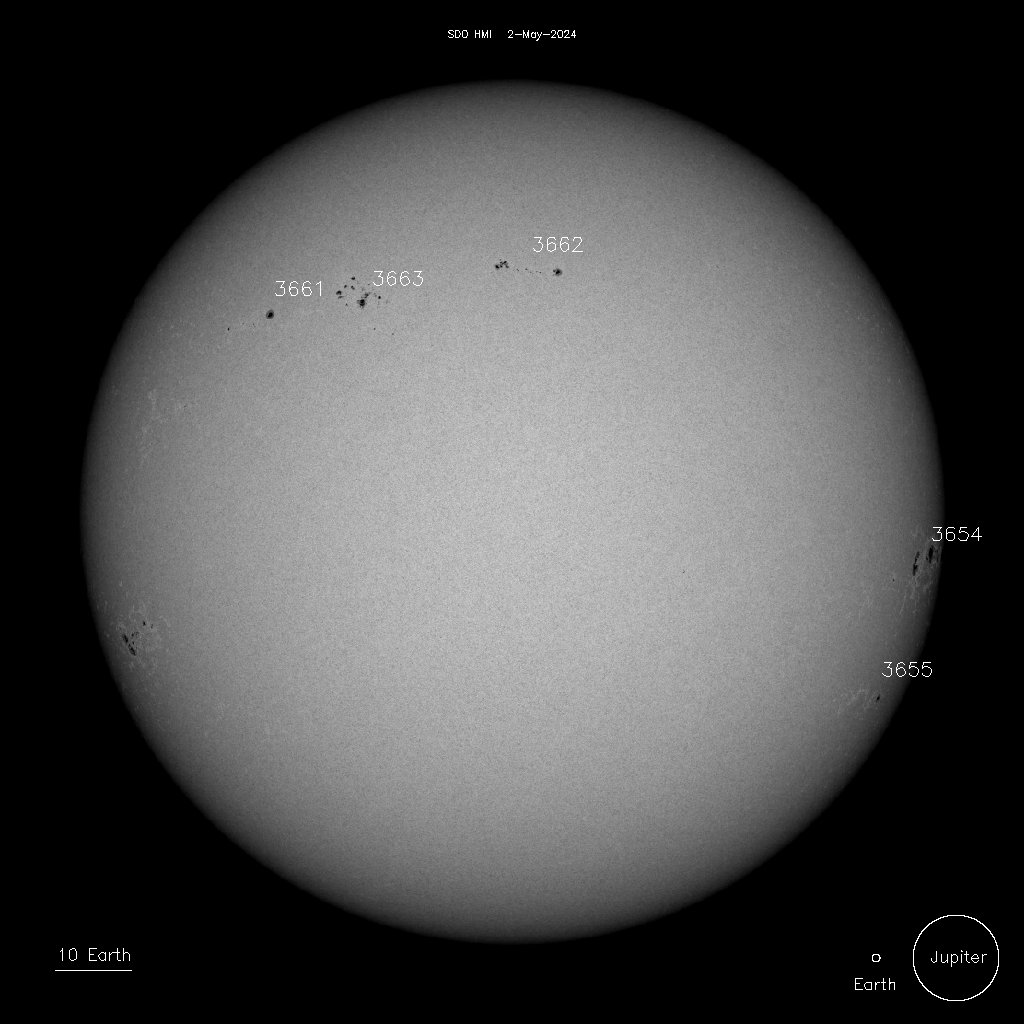
Todays sun image.

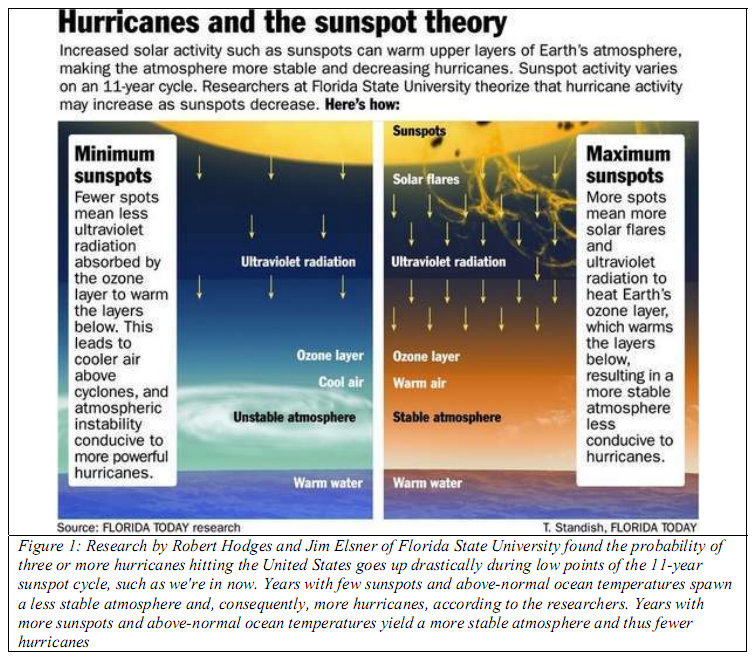
And a look at how the sun really does seem to influence the weather.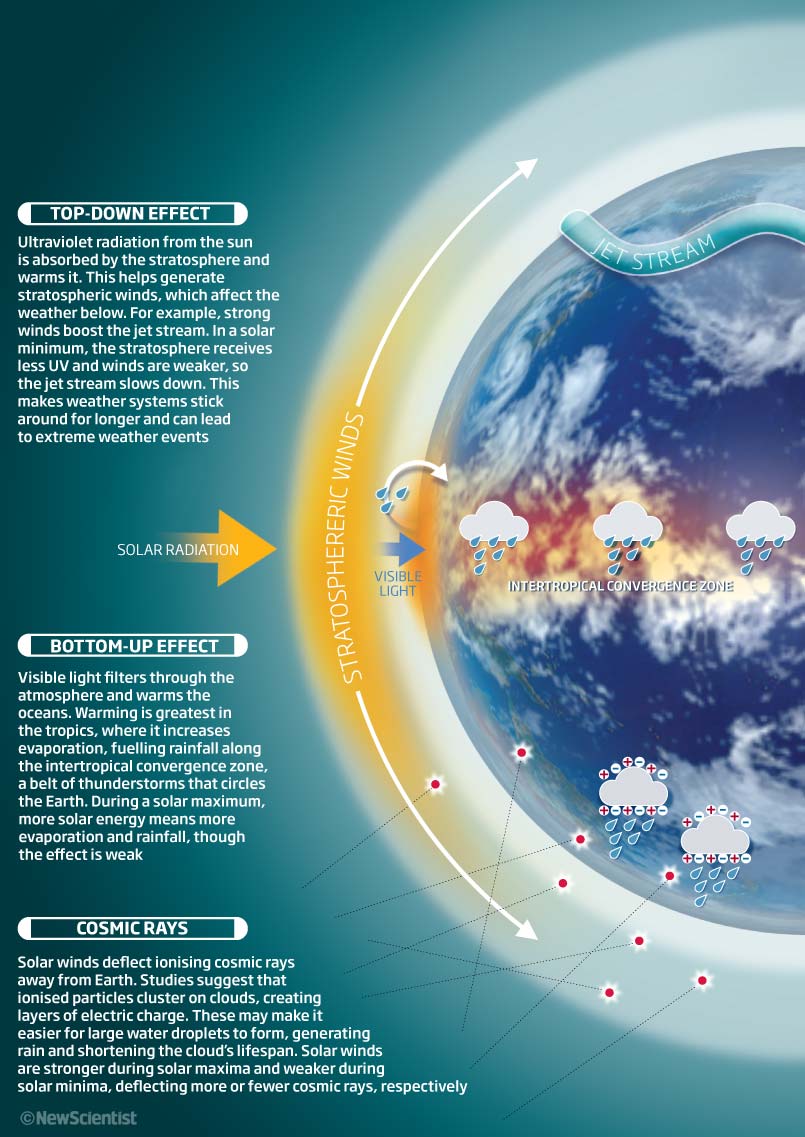
Full paper,,
http://icecap.us/images/uploads/Warming_Due_To_Ultraviolet_Effects_Through_Ozone_Chemistry.pdf
Im still waiting on the CERN results,so if anyone come across it before i do,please do post them up.
For those who don't know what i mean here's a link to what there up to.
http://www.space.dtu.dk/English/Research/Research_divisions/Sun_Climate/Experiments_SC/CLOUD.aspx
And finally an excellent vid,Get talking bout solar influence 15 min in but is all interesting.
And Prof Shaviv,
0 -
We are supposed to be near a solar maximum now.Sunspot number: 0
What is the sunspot number?
Updated 13 Aug 2011
Spotless Days
Current Stretch: 1 day
2011 total: 2 days (<1%)
2010 total: 51 days (14%)
2009 total: 260 days (71%)
Since 2004: 821 days
Typical Solar Min: 486 days
Updated 13 Aug 2011
http://www.spaceweather.com/0 -
http://en.rian.ru/russia/20060206/43371626.html
16:51 06/02/2006 ST. PETERSBURG, February 6 (RIA Novosti) -
Low solar activity could trigger a global freeze in the middle of the 21st century, a Russian astronomer said Monday.
Khabibullo Abdusamatov of the Pulkovo Astronomic Observatory said temperatures would begin falling six or seven years from now, when global warming caused by increased solar activity in the 20th century reached its peak, and that the coldest period would occur 15-20 years after a major solar output decline in 2035-2045.
Abdusamatov said dramatic changes in the earth's surface temperatures were an ordinary phenomenon, not an anomaly, and resulted from variations in the Sun's energy output and ultraviolet radiation.0 -
It looks quite likely that this guy was correct in the first part of his prediction in how cooling was supposed to start in about 6-7 years from 2006. However it seems to have started even quicker, after about 4 years.0
-
Advertisement
-
He went down like a sh1te in a spacesuit when he made his initial pronouncements around 2006/7
http://news.nationalgeographic.com/news/2007/02/070228-mars-warming_2.html"His views are completely at odds with the mainstream scientific opinion," said Colin Wilson, a planetary physicist at England's Oxford University.
"And they contradict the extensive evidence presented in the most recent IPCC [Intergovernmental Panel on Climate Change] report."
Amato Evan, a climate scientist at the University of Wisconsin, Madison, added that "the idea just isn't supported by the theory or by the observations."
But Abdussamatov was not fazed. If Abdussamatov is corrrect we should observe a large scale and very rapid growth in the Martian Ice Caps over the next few years as well as constantly increasing summer polar ice cap minima.Perhaps the biggest stumbling block in Abdussamatov's theory is his dismissal of the greenhouse effect, in which atmospheric gases such as carbon dioxide help keep heat trapped near the planet's surface.
He claims that carbon dioxide has only a small influence on Earth's climate and virtually no influence on Mars.
But "without the greenhouse effect there would be very little, if any, life on Earth, since our planet would pretty much be a big ball of ice," said Evan, of the University of Wisconsin.
Most scientists now fear that the massive amount of carbon dioxide humans are pumping into the air will lead to a catastrophic rise in Earth's temperatures, dramatically raising sea levels as glaciers melt and leading to extreme weather worldwide.
Abdussamatov remains contrarian, however, suggesting that the sun holds something quite different in store.
"The solar irradiance began to drop in the 1990s, and a minimum will be reached by approximately 2040," Abdussamatov said. "It will cause a steep cooling of the climate on Earth in 15 to 20 years."0 -
Wonderful Henrik Svensmark's documentary vid on climate change and cosmic rays
First CERN cloud results are out.But here is some info on what they did
Sulphuric Acid
Sulphuric acid (H2SO4) is thought to be the main chemical trace gas responsible for nucleation in the atmosphere. Formation of pure water aerosol particles or droplets is kinetically hindered by an energy barrier due to the surface tension of water. Sulphuric acid has a low vapour pressure which means it condenses easily (boiling point is 337° C) and can act as a precursor gas for aerosols. In liquid phase it can be mixed in any fraction with water. A single sulphuric acid molecule in gas phase can already bind up to two water molecules by hydrogen bonds. These sulphuric acid/water cluster collide and form larger clusters which eventually grow spontaneously by further condensation.
Sulphuric acid can easily be charged by removing one proton (H+). This leads to an HSO4- ion that can form stable clusters together with a few neutral sulphuric acid and water molecules. Furthermore this leads to a higher collision rate with further uptake of sulphuric acid and water molecules.
In the CLOUD chamber sulphuric acid is produced by oxidation of SO2 with OH radicals, which are produced by reaction of water with singlet oxygen (O(1D)) that is produced by photolysis of ozone (O3).
Recent atmospheric measurements and theories suggest that other species may play an important role in nucleation as well. The influence of these species on nucleation and possible mechanisms are subject of further experiments.
Ion-Induced Nucleation
Nucleation is the formation of aerosol particles from precursor vapours like sulphuric acid. The process depends on both thermodynamic and kinetic properties of the system. Gas particles form clusters through kinetic collisions, which will often evaporate because a single-particle state is more energetically favourable than a multi-particle cluster.
When clusters of particles reach a certain critical size, there is an energy cost rather than an energy gain associated with evaporation. The inclusion of an ion within the cluster can reduce the size of this critical cluster significantly, making new particle formation much more stable.
Because atmospheric ion concentrations are largely determined by the intensity of galactic cosmic rays, ion-induced nucleation is a mechanism which could explain the observed cosmic ray-climate correlation. This is especially true in a clean, pre-industrial atmosphere, where nucleation would contribute a much large proportion of atmospheric aerosol.
Aerosol-Climate Effects
Aerosol Direct Effect
Aerosol affect the Earth's climate directly, by absorbing the sun's light or reflecting it back into space. Dark aerosol like black carbon or dust will absorb light and have a warming effect, while light-coloured aerosol like sea spray or sulphate reflect light and cool the planet.
Aerosol Indirect Effect
Large aerosols (> 100 nm) can act as seeds on which cloud droplets form. Liquid water clouds have a strong cooling effect on the Earth's climate. When more aerosol are present in a cloud with a given amount of water, more cloud droplets will form. These droplets will be smaller. The result is an increase in the cloud's albedo; polluted clouds reflect more light into space, and cool the climate more effectively.
The cloud will also have a longer lifetime, because smaller droplets are less likely to rain out. The aerosol indirect effect is larger than the direct effect, and more difficult to quantify.
Atmospheric aerosols exert an important influence on climate1 through their effects on stratiform cloud albedo and lifetime2 and the invigoration of convective storms3. Model calculations suggest that almost half of the global cloud condensation nuclei in the atmospheric boundary layer may originate from the nucleation of aerosols from trace condensable vapours4, although the sensitivity of the number of cloud condensation nuclei to changes of nucleation rate may be small5, 6. Despite extensive research, fundamental questions remain about the nucleation rate of sulphuric acid particles and the mechanisms responsible, including the roles of galactic cosmic rays and other chemical species such as ammonia7. Here we present the first results from the CLOUD experiment at CERN.
We find that atmospherically relevant ammonia mixing ratios of 100 parts per trillion by volume, or less, increase the nucleation rate of sulphuric acid particles more than 100–1,000-fold.
Time-resolved molecular measurements reveal that nucleation proceeds by a base-stabilization mechanism involving the stepwise accretion of ammonia molecules. Ions increase the nucleation rate by an additional factor of between two and more than ten at ground-level galactic-cosmic-ray intensities, provided that the nucleation rate lies below the limiting ion-pair production rate.
We find that ion-induced binary nucleation of H2SO4–H2O can occur in the mid-troposphere but is negligible in the boundary layer. However, even with the large enhancements in rate due to ammonia and ions, atmospheric concentrations of ammonia and sulphuric acid are insufficient to account for observed boundary-layer nucleation.
Video talking bout results,
http://www.sunnewsnetwork.ca/video/featured/prime-time/867432237001/climate-change-culpability/1144692117001
CERN Finds “Significant” Cosmic Ray Cloud Effect reactions
Best known for its studies of the fundamental constituents of matter, the CERN particle-physics laboratory in Geneva is now also being used to study the climate. Researchers in the CLOUD collaboration have released the first results from their experiment designed to mimic conditions in the Earth’s atmosphere. By firing beams of particles from the lab’s Proton Synchrotron accelerator into a gas-filled chamber, they have discovered that cosmic rays could have a role to play in climate by enhancing the production of potentially cloud-seeding aerosols. –Physics World, 24 August 2011
If Henrik Svensmark is right, then we are going down the wrong path of taking all these expensive measures to cut carbon emissions; if he is right, we could carry on with carbon emissions as normal.–Terry Sloan, BBC News 3 April 2008
Henrik Svensmark welcomes the new results, claiming that they confirm research carried out by his own group, including a study published earlier this year showing how an electron beam enhanced production of clusters inside a cloud chamber. He acknowledges that the link between cosmic rays and cloud formation will not be proved until aerosols that are large enough to act as condensation surfaces are studied in the lab, but believes that his group has already found strong evidence for the link in the form of significant negative correlations between cloud cover and solar storms. Physics World, 24 August 2011
CERN’s CLOUD experiment is designed to study the formation of clouds and the idea that Cosmic Rays may have an influence. The take-home message from this research is that we just don’t understand clouds in anything other than hand-waving terms. We also understand the effects of aerosols even less. The other things to come out of it are that trace constituencies in the atmosphere seem to have a big effect on cloud formation, and that Cosmic rays also have an effect, a “significant” one according to CERN. –David Whitehouse, The Observatory, 25 August 2011
I have asked the CERN colleagues to present the results clearly, but not to interpret them. That would go immediately into the highly political arena of the climate change debate. One has to make clear that cosmic radiation is only one of many parameters. –Rolf-Dieter Heuer, Director General of CERN, Welt Online 15 July 2011
Although they never said so, the High Priests of the Inconvenient Truth – in such temples as NASA-GISS, Penn State and the University of East Anglia – always knew that Svensmark’s cosmic ray hypothesis was the principal threat to their sketchy and poorly modelled notions of self-amplifying action of greenhouse gases. In telling how the obviously large influences of the Sun in previous centuries and millennia could be explained, and in applying the same mechanism to the 20th warming, Svensmark put the alarmist predictions at risk – and with them the billions of dollars flowing from anxious governments into the global warming enterprise. –-Nigel Calder, 24 August 2011
Jasper Kirkby is a superb scientist, but he has been a lousy politician. In 1998, anticipating he’d be leading a path-breaking experiment into the sun’s role in global warming, he made the mistake of stating that the sun and cosmic rays “will probably be able to account for somewhere between a half and the whole of the increase in the Earth’s temperature that we have seen in the last century.” Global warming, he theorized, may be part of a natural cycle in the Earth’s temperature. Dr. Kirkby was immediately condemned by climate scientists for minimizing the role of human beings in global warming. Stories in the media disparaged Dr. Kirkby by citing scientists who feared oil-industry lobbyists would use his statements to discredit the greenhouse effect. And the funding approval for Dr. Kirkby’s path-breaking experiment — seemingly a sure thing when he first announced his proposal– was put on ice. –Lawrence Solomon, National Post, 23 Feb 20070 -
Hi Redsunset, it would appear that you are the expert on solar weather so I have a question for you, if you don't mind.
Compared to this time last year, has sunspot activity increased, decreased or stayed the same? What is driving this question is my interest in arctic winters (last Nov/Dec in Ireland were mega!) and I just want to get a wee feel for how sunspot activity is at the moment.........thks in advance
Derekon0 -
Hi Redsunset, it would appear that you are the expert on solar weather so I have a question for you, if you don't mind.
Compared to this time last year, has sunspot activity increased, decreased or stayed the same? What is driving this question is my interest in arctic winters (last Nov/Dec in Ireland were mega!) and I just want to get a wee feel for how sunspot activity is at the moment.........thks in advance
Derekon
Sunspot activity has definitely increased, but not to the extent it should going into a Sunspot Maximum Cycle.
There seems to a difference of opinion around the effect the increase in Solar activity will have on our weather this winter-
Some long range forecasters now seem to think Solar Activity has picked up enough to bring us back to a normal zonal flow, while others are of the view it hasn't picked up enough to shift the pattern back to the normal circulation pattern.
One thing many do seem to agree on is an earlier start to winter this year.0 -
Actually, according to the following article the Sun has woken up significantly in recent days
http://www.space.com/12882-sun-solar-flares-faithful-sunspot.html0 -
Advertisement
-
nacho libre wrote: »Actually, according to the following article the Sun has woken up significantly in recent days
http://www.space.com/12882-sun-solar-flares-faithful-sunspot.html
that must be why the chance of aurora/7.3kp tonight
but will it be enough to have an effect on the coming winter?0 -
0
-
nacho libre wrote: »Actually, according to the following article the Sun has woken up significantly in recent days
http://www.space.com/12882-sun-solar-flares-faithful-sunspot.html
Sunspot activity is up at the moment, but is a long way short of where it should be at this part of the cycle.Sunspot number: 65
What is the sunspot number?
Updated 09 Sep 2011
Spotless Days
Current Stretch: 0 days
2011 total: 2 days (<1%)
2010 total: 51 days (14%)
2009 total: 260 days (71%)
Since 2004: 821 days
Typical Solar Min: 486 days
Updated 09 Sep 2011 0
0 -
Elijah Cold Stack wrote: »Sunspot activity is up at the moment, but is a long way short of where it should be at this part of the cycle.
Do you mean cycle as in the one in the image, as in even for a projected lower cycle, sunspot activity has been even lower than that again? Or just that it's lower than the "normal" cycles.
Yes, I've even confused myself with that one! 0 -
Strangegravy wrote: »Do you mean cycle as in the one in the image, as in even for a projected lower cycle, sunspot activity has been even lower than that again? Or just that it's lower than the "normal" cycles.
Yes, I've even confused myself with that one!
I mean it's even lower than the predicted lower cycle, the current trendline is around 50 and the predicted path is about 70.
But there is every chance of a surge of activity that alows it to catch up, oe not.0 -
Elijah Cold Stack wrote: »I mean it's even lower than the predicted lower cycle, the current trendline is around 50 and the predicted path is about 70.
But there is every chance of a surge of activity that alows it to catch up, oe not.
Nuts... will continue to follow it with interest!0 -
"The current prediction for Sunspot Cycle 24 gives a smoothed sunspot number maximum of about 70 in May of 2013. We are currently over two and a half years into Cycle 24. Five out of the last six months with average daily sunspot numbers above 40 has raised the predicted maximum above the 64.2 for the Cycle 14 maximum in 1907. This predicted size still make this the smallest sunspot cycle in over 100 years.
Predicting the behavior of a sunspot cycle is fairly reliable once the cycle is well underway (about 3 years after the minimum in sunspot number occurs [see Hathaway, Wilson, and Reichmann Solar Physics; 151, 177 (1994)]). Prior to that time the predictions are less reliable but nonetheless equally as important. Planning for satellite orbits and space missions often require knowledge of solar activity levels years in advance.
A number of techniques are used to predict the amplitude of a cycle during the time near and before sunspot minimum. Relationships have been found between the size of the next cycle maximum and the length of the previous cycle, the level of activity at sunspot minimum, and the size of the previous cycle.
Among the most reliable techniques are those that use the measurements of changes in the Earth's magnetic field at, and before, sunspot minimum. These changes in the Earth's magnetic field are known to be caused by solar storms but the precise connections between them and future solar activity levels is still uncertain."0 -
-
This link has come to my attention care of NW In Depth / Technical Model Discussion.Not sure if i posted it before but here it is anyway.EDIT; YES i posted it last year page 13 post 192 so maybe there copying me cause they have there other link in my same post.
http://strat-www.met.fu-berlin.de/labitzke/moreqbo/MZ-Labitzke-et-al-2006.pdf
From link;
Influence of the 11-Year Sunspot Cycle on the Stratosphere in Late Winter
The Arctic Stratosphere since 1942
Figure 3 shows in two scatter diagrams the 30-hPa heights over the North Pole in February when the modulation of the solar signal by the QBO is at its maximum. The correlations between the 30-hPa heights and the solar cycle are shown, with the winters in the east phase of the QBO in the left part of the figure,and the winters in the west phase of the QBO in the right part. The abscissas indicate the sunspot solar cycle (SSC)
The correlations are clearly very different in the two groups,with negative correlations over the Arctic in the east phase of the QBO and large positive correlations there in the west phase. (The correlation for all years is 0.1,not shown.) The numbers in the scatter diagrams are the years of the individual Februaries.
Including the February 2006, the total number of Februaries available is now
65, more than twice the number available in the beginning (Labitzke, 1987; Lab-itzke and van Loon, 1988) and comprises 7 minima and 6 maxima, see Fig. 4.
As mentioned above, the 20 years after the first publication in 1987 (filled
squares) fit very well into the scatter diagrams (Fig. 3) and confirm the earlier
results. But also the NCEP/NCAR re-analyses from 1948 until 1957 (10 years,
filled circles) as well as the six Februaries from 1942 until 1947 (REC-Index: open diamonds) fit very well and the size of the correlations (particularly in the west phase of the QBO) did not change much (see Table 1 and van Loon and Labitzke, 1994 and 2000).
The average height dierence ( H in Fig.3) between solar maxima and min-
ima is very large in the west phase winters, reaching 704 meters which is almost 2 standard deviations of the interannual variability, cf. Fig. 2.
Figure 4 presents the SSC based on the 10.7 cm solar flux for the period 1942-2006. It is indicated whether a winter (January/February) belonged to the west or east phase of the QBO.
Further, large filled symbols indicate if a MMW
was observed. This can be well decided since 1950. The definition of a MMW is based on a reversal of the zonal wind over the Arctic at the 10-hPa level. As the very early data do not reach that high we must rely on comparisons with more recent events. The 30-hPa height values derived for 1947 and 1949 (west phase of the QBO) and 1942 (east phase) must be compared in Fig.3 with neighbouring values, e.g., 1958, 1991,1970, 1960 in the west phase group, or 1985, 1963 in the east phase group, which all represent well known MMWs. Therefore, we speculate that also during the winters 1942 (Bronnimann et al., 2004), 1947 and
1949 MMWs took place.
There is a very clear tendency for the MMWs in the west phase of the QBO
to occur during solar maxima (solar flux above 150 units), Fig.3: out of 11 cases 10 took place in solar max and none in solar min and this leads to the large positive correlations with the SSC over the Arctic, as discussed above.
For the MMWs in the east phase of the QBO the situation is less clear, but
more MMWs took place during solar minima (solar flux below 110 units): 10 out of 15 MMW cases, against 4 in solar maxima. This leads to the negative
correlations in the east phase.
Figure 3: Scatter diagrams of the monthly mean 30-hPa geopotential
heights (geopot.km) in February at the North Pole (1942 till 2006), plotted against the 10.7 cm solar flux. Left: years in the east phase of the QBO (n=29); right: years in the west phase (n=36). The numbers indicate the respective years; r=correlation coefficient; H gives the mean difference of the heights (geopot. m) between solar maxima and minima. Data: + = 1st period: 1958-1986; filled squares = 2nd period:1987-2006; filled circles = 3rd period: 1948-1957; diamonds = 4th period: 1942-1947.
(REC-Index: 1942 until 1947; NCEP/NCAR re-analyses: 1948 until 2006)(van Loon and Labitzke (1994), updated).
Figure 4: Time series of the 10.7 cm solar flux, 1942 until 2006,(January+February)/2.Squares denote winters in the west phase of the QBO, circles winters in the east phase. Large filled symbols characterize the occurrence of Major Midwinter Warm-ings (MMWs). (Labitzke and van Loon (1990), updated).
[/CENTER]
==========================================================
At the moment folks we're trending at the limit mark on the 10.7cm Solar Flux graph,in relation to QBO being easterly , so would not want to get any higher if we want increase chance of a Major Mid-Winter Warming.(EVEN THOUGH THEY DON'T GUARANTEE A COLD SPELL).It all helps,:) 0
0 -
 0
0 -
Advertisement
-
Quick question to anyone would might have a decent knowledge of sunspots etc on here.
There seems to be quite a lot of sunspots on the visible Solar Disk at the moment, and the sunspot count for Sept is up on the month before, but of the say, 5 or 6 of them that are visible, only one or two at a time have been very active, the rest just pop up quietly and then disappear quietly again.
My question is to anyone who has studied earlier Solar Maximums, would this be the norm, or would the majority of sunspots on a "normal" maximum be a lot more active?0 -
As things stand at the moment, the activity this maximum will be about 60% of the previous one.0
-
Elijah Cold Stack wrote: »As things stand at the moment, the activity this maximum will be about 60% of the previous one.
Oh yeah I probably wasn't too clear, sorry, I understand that.. but I'm talking about the actual activity within the sunspots themselves.
Most have a magnetic class of A or B, which isn't very active, this is what I'm wondering, if this is normal during a typical solar maximum, for so many of the sunspots themselves to have very little magnetic activity within them.0 -
is solar activity still way below what it should be? has it increased much since all those articles came out in the news in like end of august saying the low solar activity means a very cold winter for uk this winter?0
-
It's still about 60% of what it should be at this stage of the cycle as far as sunspots & magnetic activity is concerned (relative to recent cycles). As to how that could relate to another cold winter, I don't know.0
-
Interesting article here on a link between varying UV emmisions and colder temperatures in northern europe.
http://www.bbc.co.uk/news/science-environment-15199065
I'm not sure how much faith I'd put in it myself until the data is reviewed though, as stratospheric measurements are usually quite innacurate.0 -
Talking about UV on rte radio 1 right now0
-
http://www.youtube.com/watch?v=ChESOH9c0Mo&feature=youtube_gdata_player
A graphical comparison of solar cycles 21, 22, 23 and 24 Solar cycle 24 has initially displayed less activity than recent cycles. Based on statistical models the monthly smoothed sunspot number is likely to peak between 50 and 70 in 2013. Models based on solar polar magnetic field strength indicate the peak could occur as early as in 2012. The comparison with recent cycles is interesting to track the development of cycle 24.
The X axis in the chart is the number of months since the cycle started, while the Y axis is the monthly smoothed sunspot number. Chart color overview Cycle Monthly smoothed sunspot number 21 Blue 22 Black 23 Red 24 Violet Cycle 21 started in June 1976 and lasted 10 years and 3 months. Cycle 22 started in September 1986 and lasted 9 years and 8 months. Cycle 23 started in May 1996 and lasted 12 years and 6 months. Cycle 24 started in December 2008. Please note that the start dates for each cycle is calculated using the 13-month smoothed monthly mean sunspot number. One advantage of using this statistical (numerical) approach is that the start month of a solar cycle is the same as the month of the solar minimum. It is possible to use other criteria to separate solar minimum and the start of a solar sunspot cycle, however, which criteria to use and how much importance each is given, unfortunately leaves room for individual opinion[0 -
^ also on rte player about six minutes from the end.0
-
Advertisement
-
If sunspot numbers have increased recently but the activity from each sunspot still quite subdued will this have a knock-on effect with this winter?0


 https://www.youtube.com/watch?v=ANMTPF1blpQ


 https://www.youtube.com/watch?v=ChESOH9c0Mo
Advertisement