Advertisement
If you have a new account but are having problems posting or verifying your account, please email us on hello@boards.ie for help. Thanks :)
Hello all! Please ensure that you are posting a new thread or question in the appropriate forum. The Feedback forum is overwhelmed with questions that are having to be moved elsewhere. If you need help to verify your account contact hello@boards.ie

A Beginner's Guide To Reading Winter Charts

  • 10-11-2011 6:52pm
    #1
    Closed Accounts Posts: 4,279 ✭✭✭


    For the newer members on here, it might be a good idea to give a brief guide to what to look for on the charts as we head into wintertime - a time when many boardsies come back to the feeding ground after 8 months wandering the plains. As people jostle for position around the trough (pun intended!), tempers can flare up, and some can get chased way, back to other grounds in such places as Coleraine.....

    Firstly, there are several computer forecast models run by various agencies throughout the world. These models take in observational data from surface stations, ships, buoys, weather balloons, satellite and other sources, and run complex physical equations to determine the state of the atmosphere at various intervals into the future. Some models only deal with a limited area of the globe for a couple of days into the future (eg. HiRLAM (European Hi-Res Limited Area Model, NAE, RUC, etc), while other global models deal with the whole globe, for periods of several days to over two weeks (eg. ECMWF (European), GFS (USA), UK Met, GEM (Canadian), BOM (Australian), JMA (Japanese), etc.

    Different models have different amounts of freely-available data to the public (eg. ECMWF - widely regarded as the best overall perfomer, run twice a day, but few freely-available data), while others have more. The GFS has the best array of data available, on a wide number of atmospheric variables, and is hence one of the more popular ones used on places like boards. It also runs four times a day, out to 384 hours (16 days), and so it the one used in the Fantasy Island thread.....

    Here is one good source of models most people here use.....
    http://www.meteociel.com/modeles/ukmo2.php?carte=1021&ech=6&archive=0


    When determining the potential for cold weather, there are some key variables to look at. The first is the "upper chart" (500 or 300 hPa), which gives an outline of the broad global pattern of upper waves in the jet stream (at around 5.5 km and 9 km, respectively). As pressure falls with height, each pressure will be found at a certain height (geopotential) as you go up in the atmosphere. In general, the main "pressure levels" are 1000 hPa (near gound level), 850 hPa (around 1450 m), 700 hPa (around 3 km), 500 hPa (around 5.5 km) and 300 hPa (around 9 km). The exact height of these pressure levels (geopotential) is a function of the temperature of the atmosphere at that time - the warmer the atmosphere, the higher the pressure level will be, as warm air is less dense than cold air.

    An area of low geopotential corresponds to a cool airmass and is called a trough or depression, while and area of high geopotential corresponds to warmer airmass and is called a ridge or high. These areas of low and high geopotential form the familiar Rossby wave pattern in the atmospheric circulation around the globe. These upper features are a driving force for systems at lower levels, including surface storms, fronts, etc.

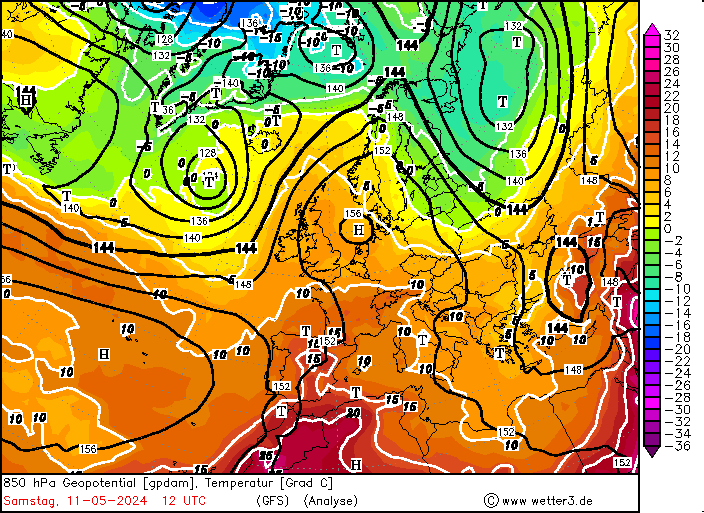
    Linked to these pressure levels are corresponding temperatures. Cold upper temperatures makes the atmosphere unstable, meaning warmer, less dense, air from below finds it easier to rise to great heights, forming showers and thunderstorms. Warmer air at upper levels puts a "cap" on such convection, and usually leads to more stable weather, with layered clouds. For snow lovers, a favourite chart is the 850 hPa one, which gives geopotential (in decameters, dm) and temperature of that level. To get snow at sea level, we generally look for 850 hPa temperatures (T850) of at least -8 °C, but it can still snow at -4 °C if conditions are right in the lowest layer of the atmophere (boundary layer).

    00_25.gif

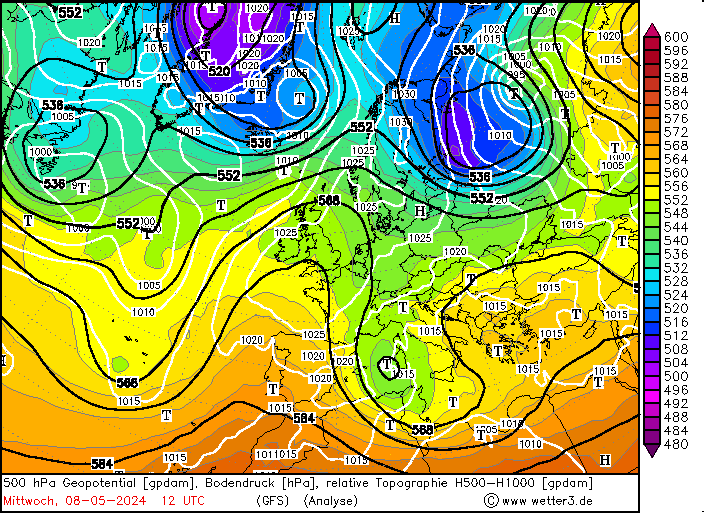
    Another important chart is the 500 - 1000 hPa thickness chart, which shows the thickness of the layer of atmosphere between the 1000 and 500 hPa pressure levels. As described above, the colder the airmass, the denser the air, and hence the closer these two levels will be. For snow in Ireland, usually we need somewhere around 528 dm or lower, as this will ensure that the airmass is probably cold enough at all levels for snow to survive the descent to the surface.

    00_1.gif

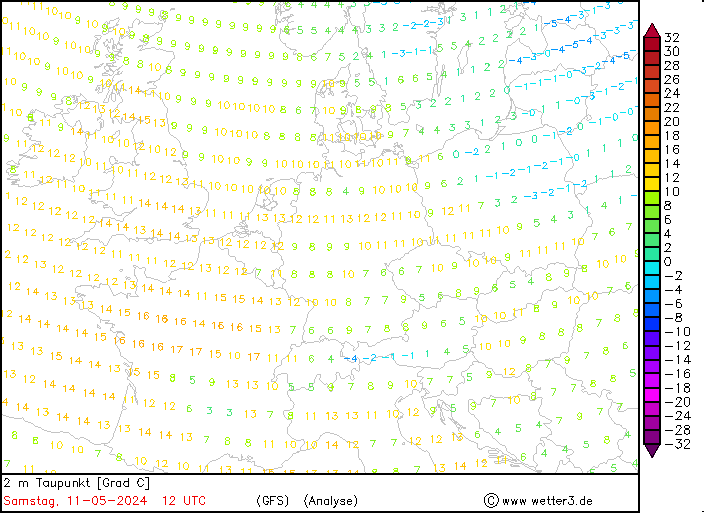
    Of course, we need to also factor in conditions at the surface. Snow can fall with surface temperatures of below around 4 °C, provided the wet-bulb temperature is at zero or below. We look at the dewpoint readings to figure this out, as the wet-bulb temperature is usually around one third of the way between the dewpoint and dry-bulb temperature. So if the dry-bulb temperature is +3 °C, and dewpoint is -2 °C, the wet-bulb temperature will be around zero or just below, and snow is pretty likely.

    Dewpoint
    00_32.gif

    All too many times, conditions in Ireland can be "marginal", with a very fine line between rain and snow. That's when the "lamppost watching" takes place, with people desperately watching for those sleety drops to turn fluffier and fall slower as snowflakes......then they come on here and proclaim to the world that they have found the white gold!


«1

Comments

  • Registered Users Posts: 502 ✭✭✭nerrad1983


    Thanks very much for that Su:D

    I can make a little more sense of them now

    Hoping to see good ones predicting plenty of snow and the likes over the next few months


  • Registered Users Posts: 1,248 ✭✭✭kstand


    Thanks very much Su - will use this as reference in future.


  • Registered Users Posts: 347 ✭✭isle of man


    Pin this for winter i say.


  • Posts: 6,025 ✭✭✭[Deleted User]


    Thanks, that was a great idea. I been lurking around the weather forum for ages, and still couldnt quite get the charts. this I can study :)

    :o:D


  • Registered Users Posts: 5,961 ✭✭✭TheMilkyPirate


    Well done Su. Don't know why this wasn't done two years ago.

    Thread needs to be stickied for all the new people this winter.


  • Advertisement
  • Closed Accounts Posts: 4,279 ✭✭✭Su Campu


    Another thing I should have mentioned is Lake Effect snow. This gets its name from the Great Lakes in the US, but we are affected by the same phenomenon here too.

    As a cold airmass moves over a relatively warm sea, the sea warms the lowest layers of air, which then move up through the atmosphere to produce showers, as I described above. If the difference between the water temperature and the T850 is 13 °C or more, and wind does not vary in direction by more than 60 ° between the surface and 700 hPa level, then heavy bands of showers can form, and if the airmass is cold enough (so T850 around -8 °C or lower, then these showers will most likely fall as snow.

    This is what happened last winter, especially in the run up to Christmas, as countless flights were cancelled at Dublin Airport, with "streamers" of lake effect snow showers continuously tearing in off the Irish Sea.


  • Registered Users Posts: 6,867 ✭✭✭pauldry


    wow SU your wealth of knowledge has me stunned:eek:

    all i know is warm front mild and cold front cold

    clouds rain blue sun.

    well i know a bit more but jaysiz it all makes perfect sense now


  • Registered Users Posts: 14,317 ✭✭✭✭M.T. Cranium


    Here are some juicy historic set-ups for snow (note that the maps are for 00z and sometimes the historic snowstorm would be on the day ending rather than beginning at that midnight, or overlapping for two or more days):

    http://www.wetterzentrale.de/pics/archive/ra/1917/Rrea00119170402.gif

    http://www.wetterzentrale.de/pics/archive/ra/1933/Rrea00119330225.gif

    http://www.wetterzentrale.de/pics/archive/ra/1978/Rrea00119781231.gif

    http://www.wetterzentrale.de/pics/archive/ra/1987/Rrea00119870114.gif

    http://www.wetterzentrale.de/pics/archive/ra/1963/Rrea00119630206.gif

    http://www.wetterzentrale.de/pics/archive/ra/1947/Rrea00119470204.gif

    http://www.wetterzentrale.de/pics/archive/ra/1982/Rrea00119820108.gif

    This final set-up gave huge blizzards in southern England, perhaps somebody could research what happened in Ireland:

    http://www.wetterzentrale.de/pics/archive/ra/1881/Rrea00118810120.gif


    In general, for heavy snow that is more extensive than just "sea effect" streamers, it is good to see this combination on the chart:

    -- 850 mb temps below -5 C (ideally -8 C) ... can tolerate higher values because of next factor

    -- surface pressure gradient better than 12 mbs from Dublin to Valentia ideally a closed low near south coast

    -- system feeding on long-fetch easterly to north-easterly with typical air mass temps in -5 to -10 C range

    Weaker set-ups can still be potent on a meso-scale or local scale but then sea-effect is the primary driver ... these historic cases seem to be a blend of synoptic scale and enhancement from sea-effect.

    The best snowfall events have been associated with lows either developing "in situ" over south coastal regions with a drift to either east or southwest, or, travelling lows that move almost due east along 50 to 51 N towards the Channel. Good set-ups for southeast England may include lows in northern France that could head northeast or even north. While similar set-ups are possible for Ireland, with lows moving north from Brittany, the problem is usually too much mild air advection in a southeast flow, but a set-up like that could dump heavy snow on higher terrain even though it could be raining or sleeting near sea level.


  • Closed Accounts Posts: 2,693 ✭✭✭Redsunset


    Can't get any of them links to work.


    EDIT Links working perfect now,thank you.


  • Registered Users Posts: 14,317 ✭✭✭✭M.T. Cranium


    Meanwhile, here are some cases where heavy snow developed in some parts of Ireland and the UK from polar northwest to northerly flows:

    http://www.wetterzentrale.de/pics/archive/ra/2004/Rrea00120041225.gif

    http://www.wetterzentrale.de/pics/archive/ra/2010/Rrea00120101217.gif

    http://www.wetterzentrale.de/pics/archive/ra/1969/Rrea00119690202.gif

    (note: links are now fixed and should be working for you)

    If you would like to see the correpsonding 850-mb charts (which have been reconstructed back to the 19th century, of course they didn't actually measure upper air values until about 1942 ... when you have the map on your screen, go to the address link and change the 001 before the year to 002, that will give you map 2 for the same date and that's the 850-mb chart. These have been back-cast from surface data correlations in the older maps. Check out that 20 Jan 1881 chart for its 850-mb values. Juicy. Now if you want to see a sequence, you could go to the source (wetterzentrale) or you could change the map dates, same general idea, boot up the map you want and change the last two numbers which are the date, and the two before them if you need to change the month as with 19781231 then 19790101 but if you change the year you have to go back further in the address and change it twice.


  • Advertisement
  • Registered Users Posts: 5,961 ✭✭✭TheMilkyPirate


    Great posts also MT, I've been looking at old charts for the last hour!


  • Registered Users Posts: 61 ✭✭YESROH


    great post guys - you should write a book between you all as I hve yet to find one that explains things a simply with examples.


  • Registered Users Posts: 594 ✭✭✭carfiosaoorl


    Thank you for this thread:D. I have been lurking in here since last winter. Now I might be able to make some sense of all the rigamarole. The charts are like double dutch to me:o


  • Registered Users Posts: 5,565 ✭✭✭Pangea


    baraca wrote: »
    Well done Su. Don't know why this wasn't done two years ago.

    Thread needs to be stickied for all the new people this winter.

    Well it was to an extent but never kicked off :pac:
    http://www.boards.ie/vbulletin/showthread.php?t=2055448904&page=2
    Some useful information in that thread too incase anyone wants a look or to copy any info to here.


  • Closed Accounts Posts: 144 ✭✭Diamond Dust


    Great read , very interesting


  • Registered Users Posts: 1,777 ✭✭✭Joe Public


    Sometimes Meteireann show the same temps in different shades of orange when showing the summary maps for the next 5 days on TV. i.e. you might have 12C in pale orange on one map and a redder shade of orange on another map. Why the different shades for the same temps? what does it signify?


  • Registered Users Posts: 14,317 ✭✭✭✭M.T. Cranium


    Lack of concentration? ;)


  • Registered Users Posts: 1,777 ✭✭✭Joe Public


    It happens a bit often for lack of concentration so I'm beginning to think it means something.


  • Registered Users Posts: 16,622 ✭✭✭✭nacho libre


    Meanwhile, here are some cases where heavy snow developed in some parts of Ireland and the UK from polar northwest to northerly flows:

    [/U]

    Christmas 2000 was also a good example of this. Some parts of the northwest had close to a foot of snow. God i hope this isn't a pattern after last year, whereby we to have wait another 10 years for an epic snowfall:(


  • Advertisement
  • Registered Users Posts: 14,317 ✭✭✭✭M.T. Cranium


    I think the new thread, "How to Change Winter Charts" will be even more popular. :cool:


  • Registered Users Posts: 876 ✭✭✭sirpsycho


    Dont think anyone mentioned the North Atlantic Oscillation (NAO - http://en.wikipedia.org/wiki/North_Atlantic_oscillation). If you get a negative phase of the NAO it can bring cold weather over us too.

    Further reading here: http://en.wikipedia.org/wiki/Winter_of_2010%E2%80%932011_in_Europe


  • Closed Accounts Posts: 4,279 ✭✭✭Su Campu


    For us, the 850-1000 hPa thickness is a more important value to watch. The 500-1000 hPa is a good first guess, as if that's not right in the first place, then snow is pretty unlikely, though freezing rain still is, if there's a sub-zero layer near the surface. 528 dam is a good first guess, but 522 would probably guarantee snow at sea level, regardless of anything else.

    The 850-1000 thickness shows the mean temperature of the lowest, i.e. the most important, layer of the atmosphere, where the physics comes into play. You could have a very cold mid and upper atmosphere, with lowish 500-1000 values, and even cold 850 temperatures, but it's the boundary layer that is most affected by modification by surface characteristics, and the one that snow must survive in order to reach us intact.

    Have a look at the 850-1000 thickness charts, which are freely available for the GFS and NAE. If we get around 1280 dam or lower, then snow's fairly certain.

    11112109_2106.gif

    One thing to remember though - thickness is related to the average virtual temperature of the layer, which also includes humidity. For the same temperature, a humid layer will have a greater virtual temperature, and hence a greather thickness, than a dry layer. However, the drier the layer, the less chance there is of heavy snowfall. It is therefore a fine balance of looking at several factors at once, which is why things can be so marginal in some cases where some factors would shout snow.


  • Registered Users Posts: 3,133 ✭✭✭Rebelbrowser


    Someone posted this on Netweather. Well worthy of repetition here.........

    "Just a small guide that hopefully everyone will find interesting, if not useful for this winter

    It's quite quick, and not very detailed, and focuses only on the 850mb, and hp influences... just a quick note that these averages for the most part are vague and depend on exact conditions.

    For much of winter, 850mb temperatures average between -2c in northern scotland, to around 1c in southern england. Generally, if you see values around the freezing mark from December to February on the 850mb charts, this would indicate rather average weather, possibly slightly above average weather if you are under lp or are very close by, and perhaps slightly below average under high pressure.

    Temperatures between 1-4c 850mb are what we usually are accustomed to, apart from in colder spells. This usually means that the weather will be slightly above average (above average under low pressure and average with high pressure). All depends usually on cloud cover (high cloud cover would usually mean suppressed maxima, but mild minima, and low cloud cover/clear skies usually give slightly above average maxima, but cooler minima, however this does not always happen).

    At the higher end, 4-8c 850mb temperature indicates very mild weather, often by day and by night. This in a normal example with a sw wind and hp nearby would give a max of say 13-15c under clear skies, around 9-11c under cloudier/wetter skies, and minima of around 4-6c under clear skies, 7-9c under cloudier/wetter skies. In the mildest scenario, 850's above 8c can occur, this gives temperatures more likely in September, perhaps getting past 16-18c!

    Now, to go back a bit, under -1c to -4c uppers (850mb temperatures), we would expect slightly cooler weather (especially so by day under a easterly/southeasterly flow and especially so by night under a northwesterly/westerly scenario, usually). Under a maritime flow, you can expect snow/sleet at about 1250m under -1c 850's, and about 600m under -4c 850's. Under a continental flow, you can expect snow/sleet at about 750m under -1c 850's, and about 300m under -4c flows, but this is a general rule, and there can be many exceptions. Of course under a continental flow, precipitation is harder to get, unless you have a very unstable north east/east flow with much colder uppers travelling over the north sea.

    -4c to -8c upper temperatures usually give snow throughout the nation, especially under a continental flow. -8c uppers would deliver maritime-source snowfall to sea level, whilst -6c continental source air generally would. For much of England, Scotland, Wales and Northern Ireland, land is between 50-300m above sea level and so -6c/-7c maritime source air and -5c/-6c continental source air would deliver snow (but you need cold uppers to give moisture from the north sea, generally -7c or less). This temperature of upper air usually gives very cold air.

    Below -8c and snow is certain. Usually very cold air from the north or north east would give this, but if easterlies align themselves perfectly, we can get very cold air from them (up to -18c/-19c reaching east anglia/se england is possible and has happened under potent easterly flows!).

    For those living near the north sea, or generally are affected snow-wise by north east or east winds, not only does the 850's need to be under -5c, but the difference between the 850's and the sea temperatures must be 13c or more to deliver snow (i.e. -6c 850s, 6c sst's = no precipitation, -6c 850's, 8c sst = some precipitation, snow). This is why some areas got so much snow of the north sea last year, a combination of cold air (-7c to -11c 850's often) and very warm seas as they haven't cooled down yet (the average november sst's on the east coast are between 7c and 11c), gave intense snowfalls due to large moisture.

    I know this is rather cold-orientated, but it's more of a winter guide, and so is dedicated to more wintry weather."


  • Registered Users Posts: 5,105 ✭✭✭John mac


    wasn't sure where to post this . Here's an scientific explanation as to why its so hard to predict the weather,
    http://www.bbc.co.uk/iplayer/console/b00ss1j2
    from 10 mins. (if you want to go direct)


  • Registered Users Posts: 3,426 ✭✭✭ZX7R


    Can anyone give the times thr chart come out at ie. the ooz,6z/18z.ECT:confused:


  • Registered Users Posts: 3,133 ✭✭✭Rebelbrowser


    ZX7R wrote: »
    Can anyone give the times thr chart come out at ie. the ooz,6z/18z.ECT:confused:

    There is usually a four lag for gfs and a six hour lag for ecm. ukmo is in between. only gfs comes out 4 times a day.


  • Closed Accounts Posts: 482 ✭✭Jim_Kiy


    The Met.ie Radar ..is it archived i.e can I see the images from 26/10/11?
    Was away that day and would nice to see the images with all that rain in the East.


  • Closed Accounts Posts: 2,693 ✭✭✭Redsunset


    Jim_Kiy wrote: »
    The Met.ie Radar ..is it archived i.e can I see the images from 26/10/11?
    Was away that day and would nice to see the images with all that rain in the East.


    Met Eireanns warning
    Weather Warning

    Issued at 23 October 2011 - 19:45
    Severe weather Warning update issued at 1945
    Extremely wet and windy for a time, with some further spot flooding, but conditions will improve before morning. But further pulses of heavy rain are expected to develop by Monday afternoon, with the heaviest of the rain expected in eastern coastal counties, giving some flooding in places.
    Valid from 2000 hours on Sunday 23/11/2011 until 0600 hours on Tuesday 25/10/2011

    http://www.met.ie/climate/monthly_summarys/oct11sum.pdf

    Radar images at end of pdf file from Met Eireann
    http://www.epa.ie/downloads/pubs/water/flows/Flooding%20on%20the%20East%20Coast%20-%2024th%20October%202011.pdf

    Threads for the 23rd and 24th when the deluge came. There are some saved radar images in both threads.

    http://www.boards.ie/vbulletin/showthread.php?t=2056426381

    http://www.boards.ie/vbulletin/showthread.php?t=2056430152


    Also I saved a couple of images,

    meteireann-radar-390x285.jpg

    201083.JPG

    201084.JPG

    201085.JPG


  • Advertisement
  • Registered Users Posts: 385 ✭✭DaithiMa


    Here are some juicy historic set-ups for snow (note that the maps are for 00z and sometimes the historic snowstorm would be on the day ending rather than beginning at that midnight, or overlapping for two or more days):


    This final set-up gave huge blizzards in southern England, perhaps somebody could research what happened in Ireland:

    http://www.wetterzentrale.de/pics/archive/ra/1881/Rrea00118810120.gif


    I looked into some old newspaper reports regarding the 1881 event in England and it was also an epic event in Ireland. Reports are of a huge snow storm, and first appear in the freemans journal on the 19th of january 1881. "snowdrifts to depths of at least a foot, if not more accumulated at points exposed to the wind". Tram lines were snowed out of action.This is followed by a number of reports from the 21st onwards of further snow in Dublin, as well as in other parts of Ireland, including mullingar , bray and newtonards. Other reports describe drifts in north dublin to at least "half the height" of train carriages. Sounded like quite an event!


Advertisement