Advertisement
If you have a new account but are having problems posting or verifying your account, please email us on hello@boards.ie for help. Thanks :)
Hello all! Please ensure that you are posting a new thread or question in the appropriate forum. The Feedback forum is overwhelmed with questions that are having to be moved elsewhere. If you need help to verify your account contact hello@boards.ie
Hi all,
Vanilla are planning an update to the site on April 24th (next Wednesday). It is a major PHP8 update which is expected to boost performance across the site. The site will be down from 7pm and it is expected to take about an hour to complete. We appreciate your patience during the update.
Thanks all.

SUDDEN STRATOSPHERIC WARMING (Watch 2012-2013)

1235»

Comments

  • Registered Users Posts: 245 ✭✭Blizzard 2010


    Harps wrote: »
    That warming is fizzling out at the moment (at the 10hPa level at least) with the forecast showing the strat cooling down again.

    What do you mean by displacing the vortex across the Atlantic? At lower tropospheric level there's a strong signal for the PV to stay in-situ over Canada right out to 384h. My limited knowledge of SSW's is that they can weaken or even disintegrate the PV but there's no clear signs of anything like that happening. I'm not trying to argue your point, just a bit confused by it all with nothing really happening with the vortex other than that Arctic High and the painfully slow flow pattern of late

    gensnh-21-1-384_zfg5.png
    There you go!! Who's talking utter nonsense now Beasterly


  • Registered Users Posts: 39 Capillatus


    this warming event has being going on for over two and a half weeks now (6th of January) The present cold snap has nothing to do with a SSW event. If it did we would the have the full effect of it

    Well, the first cold weather you had, around the 14th, was SSW connected. That was the result of the SSW polar vortex disruption, and the wave 2 vortex split. The wave 2 was coming strong from the Atlantic, so when the split occurred, it was more or less instantaneous throughout the troposphere and stratosphere. Basically geopotential height rises near and over the pole.

    A few graphics.

    compday891439512335623.gif

    compday891439512335719.gif

    compday891439512335726.gif

    compday89143951233581.gif

    And just prior to the cold/cool shot (I am not sure for the islands, but here in central EU it was a cold shot, not a cool shot :))
    compday89143951233597.gif

    compday891439512335817.gif

    As for this second cold shot, it was amongst all, also an SSW response. I say amongst all, because the troposphere has its own dynamics and forcings besides the stratosphere, so SSW is not the main factor, but it plays an important role. In blue, I marked the height rises connected with the first split. And in green, we actually have the real SSW effect infiltrating into the troposphere, with respect to the SSW response time-lag climatology.

    timepreshgtanomjfmnh2013.gif

    This SSW had a decent downwelling.

    timeprestempanomjfmnh201.gif

    And on this graph, we can see a bit more obviously, how the SSW induced effect downwelled.

    hgtaocdas.gif

    And a few graphics:

    compday891439512335922.gif

    compday8914395123404.gif

    compday89143951234038.gif

    ecmepsz500anh1.png

    ecmepst850anh1.png

    So, @Blizzard 2010, don't get me wrong, I respect your opinion. I just haven't seen any graphics in your posts, that would back you up.
    I write on many different forums (some of you also know me as Recretos on Netweather), and on most of them if not all, people were seeing this SSW as a 100% guarantee for a severe winter or cold period. But that is not how stuff works. At least on NW forum, me and some others were trying to point out the fact that even tho an SSW statistically increases chances for EU cold shots, it cannot 100% guarantee its occurrence and especially not its longevity, because of the constant tropospheric dynamics and forcings constantly mixing in this year, especially the MJO.

    So the bottom line is, both cold shots had a "connection" with the stratosphere and the SSW, especially the last one.

    Best regards.


  • Registered Users Posts: 245 ✭✭Blizzard 2010


    That's correct I haven't produced any charts I base my opinions on present model output and what I see. I do respect your opinion and the work you have done .Whether the present cold snap is due to SSW is for me anyway is debatetable. I have said previousy that a SSW can be a hit and miss affair and for me It is a miss


  • Registered Users Posts: 1,789 ✭✭✭BEASTERLY


    Harps wrote: »
    That warming is fizzling out at the moment (at the 10hPa level at least) with the forecast showing the strat cooling down again.

    What do you mean by displacing the vortex across the Atlantic? At lower tropospheric level there's a strong signal for the PV to stay in-situ over Canada right out to 384h. My limited knowledge of SSW's is that they can weaken or even disintegrate the PV but there's no clear signs of anything like that happening. I'm not trying to argue your point, just a bit confused by it all with nothing really happening with the vortex other than that Arctic High and the painfully slow flow pattern of late

    gensnh-21-1-384_zfg5.png

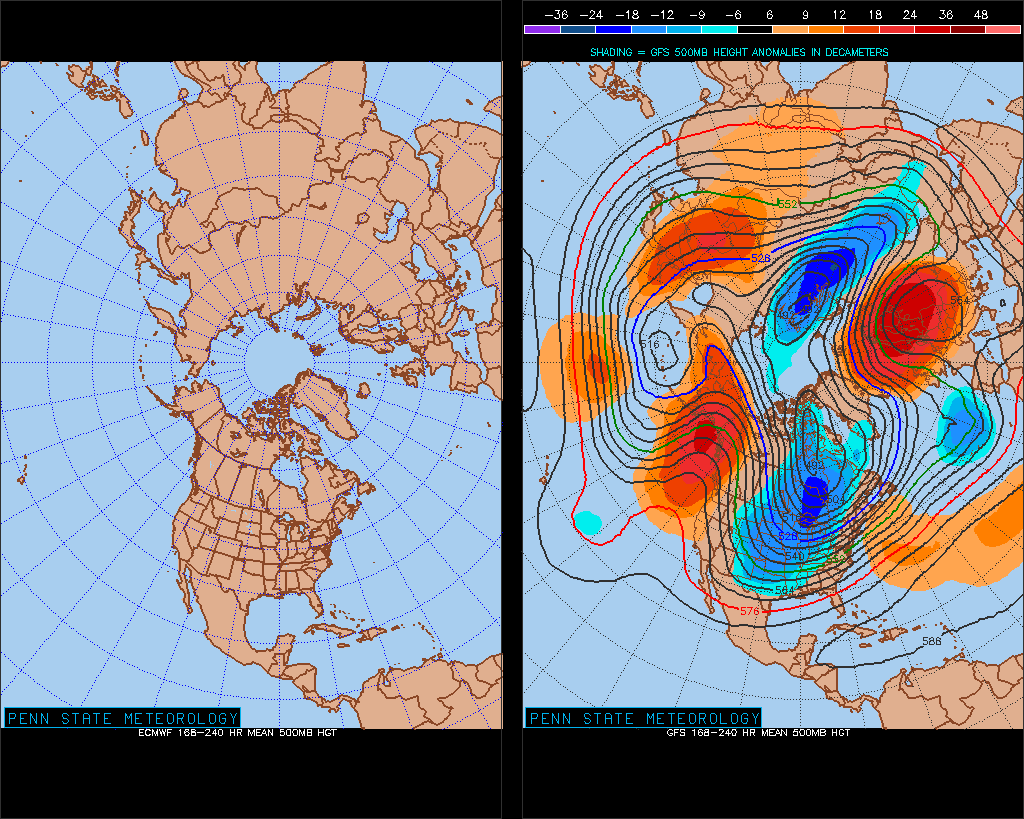
    I'm going to go ahead and repost this from chionamiac over on Netweather, pistolpetes already posted it but it illustrates what I'm trying to say better than I ever could.
    Stratospherically we are still seeing a NH pattern dominated by the recent SSW. Contrary to some opinions, this has downwelled from the mid stratosphere and affected the troposphere. It is always hit and miss how and where the SSW can have knock on effects in the troposphere and it appears that we have been lucky to see the split vortex favourably positioned to prevent the jet stream powering through during the two week mid January period.

    However, that is about to change as further warming of the stratospheric Canadian vortex which allows it's tropospheric counterpart to break free. West to east momentum initially is set to carry this across the Atlantic to its Siberian counterpart as can be seen in this 30 hPa chart.


    As this occurs there will be a corresponding increase in Atlantic mobility allowing the westerlies to reach the UK rather than be held at bay. The stratospheric vortex even though weak will be positioned on the Atlantic sector meaning a far less meridional jet stream whereas the Pacific sector will have a far more disturbed flow due to the upper ridge holding strong. This pattern will be as of a direct consequence to recent stratospheric events - but the wheel of fortune will be dropping off the meridional cold flow elsewhere in the NH.

    So the main question that everyone is asking is will we likely to see a pattern re- emerge that can bring back the cold and blocking to our shores. And the answer is not immediately but definitely not no!

    With the weakened vortex conditions likely to persist for a period of time then it is only a matter of time before realignment occurs in line with the MJO and GWO.

    The stratospheric forecasts during the next 10 days right up to 10 hPa are showing and will show signs of increased fluctuations in the exact position of the vortex.

    There are signs of another split occurring around day 10 and this will need to be watched carefully.


    If this does occur then we could quite easily see the door to returning cold opened back up again. I think we will need to keep an eye on the strat forecasts very closely in this period.


  • Moderators, Science, Health & Environment Moderators Posts: 7,145 Mod ✭✭✭✭pistolpetes11


    no more name calling or one liners, you running what is a very good thread , final warning on this


  • Advertisement
  • Closed Accounts Posts: 163 ✭✭Dead_Rabbits


    @ Pistolpete11

    Do you think the SSW can or will have an effect on the last few weeks of winter, I am beginning to lose faith that the winter will have much more to give?

    By now there should down welling into the troposphere and would you feel we have been just unfortunate the way the PV has been or can it smash up the PV in the coming 2 weeks.

    Throw us a rope!


  • Closed Accounts Posts: 3,548 ✭✭✭Harps


    Thanks for cleaning up the thread pete, not sure what was wrong with my post though :confused:

    To ask again..

    Capillatus, a quick question if you have the time (or to anyone else who can answer..), what exactly are those cross section graphs showing? For the GPH one for example, it it a section through the north pole or the mean heights value for the whole 65-90 degree area?
    @ Pistolpete11

    Do you think the SSW can or will have an effect on the last few weeks of winter, I am beginning to lose faith that the winter will have much more to give?

    By now there should down welling into the troposphere and would you feel we have been just unfortunate the way the PV has been or can it smash up the PV in the coming 2 weeks.

    Throw us a rope!

    Capillatus post above explains that the Arctic High that's been up there for the past 10 days or so was related to the SSW. For effects on us, it didn't cause anything too interesting but I've read that it aided in slowing the wave pattern over the Atlantic so we ended up with the pretty stagnant cool spell while the rest of Europe had a good cold snap.

    For February, there's no obvious signs on the basic charts on meteociel of any major effect on the vortex but forces may be at work higher up that I'm unaware of so don't pay too much attention to that!


  • Registered Users Posts: 39 Capillatus


    Harps wrote: »
    Capillatus, a quick question if you have the time (or to anyone else who can answer..), what exactly are those cross section graphs showing? For the GPH one for example, it it a section through the north pole or the mean heights value for the whole 65-90 degree area?

    It's a zonal mean, so basically you could interpret it as an "average" over the entire 65N-90N region.


  • Closed Accounts Posts: 3,548 ✭✭✭Harps


    Capillatus wrote: »
    It's a zonal mean, so basically you could interpret it as an "average" over the entire 65N-90N region.

    Thanks, makes more sense now

    Is there any way to plot a graph for a specific region or quadrant or does the downwelling even work like that? Basically what I'm asking is, if there's height rises over Greenland say down to 200hPa, is there a strong chance that it would eventually have some influence in Greenland at lower tropospheric level or could the effects propagate to somewhere else in the world? I can see from the charts you posted that there's a very obvious effect down to 100hPa and by 500hPa the anomalies are in the same general areas but with a lot more complexity in play. By 1000hPa with so many different factors effecting the weather, can the signal simply be drowned out?

    I keep reading that SSW's are very much hit and miss but if you can track the downwelling by general region early in the event then wouldn't it give a much better hint as to whether it'd have a major effect?

    Sorry for all the questions, just trying to get a better grasp of it all!


  • Registered Users Posts: 39 Capillatus


    Well, you could plot a specific region, but you would have to plot it yourself. You would have to download the datasets and "manually" plot it. But the problem would be with the dataset. Because the datasets are only focused on specific levels, like 10mb, 20mb, 50mb,... and not for the entire stratosphere like you see on those graphs. But you can plot time series for a certain level.

    If the "downwelling" reaches down to Greenland at 200mb, the chances are good that it will couple with the mid troposphere somewhere around that region. But we are not talking about super domination over the hemispheric pattern. There is just this general "rule of thumb", that with the pole and Greenland under highs or blockings, there is stronger CAA (cold air advection) into the lower latitudes, but it gets a bit more complicated with time, because of the constant tropospheric forcings. That is why it is kinda hard to find two exactly the same post-SSW effects. If you make reanalysis plots for a few SSW downwellers, the pattern may look similar at first, but you quickly get some differences with time. So basically it could be a hit or miss, or something in between.

    I made some plots for you. The time-series for geopotential height anomaly, over Greenland.

    10mb
    8914362141253365.gif

    50mb
    8914362141253351.gif

    150mb
    89143621412533920.gif

    500mb
    8914362141253413.gif

    Basically, when going down from the stratosphere, with time, the main +ve anomaly propagates slightly southward. When reaching the troposphere, it all depends on the tropospheric dynamics at that point.

    And come cross-sections for Greenland.

    compday89143621412534539.gif

    Here on the mean zonal wind, I marked the general circulation, as you can interpret.
    compday89143621412534919.gif

    And the corresponding pattern.
    compday8914362141253549.gif

    Best regards.


  • Advertisement
  • Closed Accounts Posts: 163 ✭✭Dead_Rabbits


    Thank you very much for all your info Capillatus, very kind of you to share your knowledge even though I must admit I struggle to understand pieces but I do get the general idea you are putting across!


  • Registered Users Posts: 465 ✭✭Mr Bumble


    Asked this last night but it seems to have vanished............can someone explain please why the section of the PV in Canada is trying to link up with Siberian mate? From a previous question, I learned that the PV will always try to reform but why is this so and what is driving it??? I think that's a two-liner Ppete;)


  • Closed Accounts Posts: 3,548 ✭✭✭Harps


    Thanks for the time and effort again Capillatus, don't have the time at the moment but I'll have a read through it later and see if I can make any sense of it all!


  • Registered Users Posts: 7 Not the real Gerald Fleming


    Capillatus wrote: »
    Well, you could plot a specific region, but you would have to plot it yourself. You would have to download the datasets and "manually" plot it. But the problem would be with the dataset. Because the datasets are only focused on specific levels, like 10mb, 20mb, 50mb,... and not for the entire stratosphere like you see on those graphs. But you can plot time series for a certain level.

    If the "downwelling" reaches down to Greenland at 200mb, the chances are good that it will couple with the mid troposphere somewhere around that region. But we are not talking about super domination over the hemispheric pattern. There is just this general "rule of thumb", that with the pole and Greenland under highs or blockings, there is stronger CAA (cold air advection) into the lower latitudes, but it gets a bit more complicated with time, because of the constant tropospheric forcings. That is why it is kinda hard to find two exactly the same post-SSW effects. If you make reanalysis plots for a few SSW downwellers, the pattern may look similar at first, but you quickly get some differences with time. So basically it could be a hit or miss, or something in between.

    I made some plots for you. The time-series for geopotential height anomaly, over Greenland.

    10mb
    8914362141253365.gif

    50mb
    8914362141253351.gif

    150mb
    89143621412533920.gif

    500mb
    8914362141253413.gif

    Basically, when going down from the stratosphere, with time, the main +ve anomaly propagates slightly southward. When reaching the troposphere, it all depends on the tropospheric dynamics at that point.

    And come cross-sections for Greenland.

    compday89143621412534539.gif

    Here on the mean zonal wind, I marked the general circulation, as you can interpret.
    compday89143621412534919.gif

    And the corresponding pattern.
    compday8914362141253549.gif

    Best regards.
    If I am reading what you are saying correctly, there still appears to be a lot of uncertainty, is that correct?


  • Registered Users Posts: 1,296 ✭✭✭Geomy


    I have a feeling things are going to turn around the next few weeks are going to be very interesting indeed,with heavy sleet showers and bitterly cold temps today.
    The charts could take on a whole different direction


  • Registered Users Posts: 7 Not the real Gerald Fleming


    apparently the effects of an SSW can last 2 months:eek:


  • Closed Accounts Posts: 2,693 ✭✭✭Redsunset


    Been some unfavourable conditions throughout the troposphere lately and that looks like coming to an end soon. More of easterly influence will finally be able to get down.

    time_pres_UGRD_ANOM_JFM_NH_2013.gif

    There has been a sustained warming at 30mb and now is starting to cool from top down.

    That is good because it helps flush the easterly anomaly down through the atmosphere.

    30mb9065.gif

    ECM showing the Siberian high connection and Gfs similar but further south.
    test8.gif
    hgtcomp.html


    Lower Strat forecast showing the ridging in the Atlantic and Siberian high too. All very promising.

    ecmwf100f240.gif


This discussion has been closed.
Advertisement