Advertisement
If you have a new account but are having problems posting or verifying your account, please email us on hello@boards.ie for help. Thanks :)
Hello all! Please ensure that you are posting a new thread or question in the appropriate forum. The Feedback forum is overwhelmed with questions that are having to be moved elsewhere. If you need help to verify your account contact hello@boards.ie
Hi all,
Vanilla are planning an update to the site on April 24th (next Wednesday). It is a major PHP8 update which is expected to boost performance across the site. The site will be down from 7pm and it is expected to take about an hour to complete. We appreciate your patience during the update.
Thanks all.

The ongoing stratospheric warming

  • 23-01-2009 5:40pm
    #1
    Closed Accounts Posts: 2,693 ✭✭✭Redsunset


    hi all.some of you are aware of this talk on other forums.it's looking fairly mental if it keeps on gettin warmer.two and netweather gives great info and charts on it.it's not a subject i entirely understand but am learning very quick. tis great reading.would love to hear what thoughts the rest of ye have on this.it is a bit complicated yes but it has been proven to influence our troposphere with outstanding consequences.too much detail for me to go into so have a look yourselves and post your thoughts.feb could be a little iceage if all falls into place.seems that the solar cycle is affecting it too.lookin forward to responses.:D

    `who out there believes that the strat warming will give us colder conditions? 13 votes

    yes,very cold.snow.
    0% 0 votes
    yes,but its hit and miss.
    61% 8 votes
    no,impossible.
    38% 5 votes
    no,we're just lucky sometimes.
    0% 0 votes


«1

Comments

  • Registered Users Posts: 15,316 ✭✭✭✭Supercell


    Its a subject I find fascinating myself I must admit.
    I wish I understood the teleconnections though, I really don't understand why the warming sometimes leads to cooling in our part of the world a little later.
    If anyone can make a stab at an explanation I'd love to hear it.

    Have a weather station?, why not join the Ireland Weather Network - http://irelandweather.eu/


  • Banned (with Prison Access) Posts: 8,633 ✭✭✭darkman2


    My limited knowledge of it is that it works down through the Atmosphere over time. 17 - 25 days. Warmer Poles = higher pressure. Hence why you only see high pressure over Greenland in Winter when the cold upper air shifts away from it. It's the same right across the higher latitudes.


    It happens every year and every year the prophecy is a really cold snap is on the way. The logic being that higher pressure over high latitudes leads to an Easterly or Northerly. However this is not always the case. How would we like high pressure plonked over us again for a few weeks?:rolleyes:

    Perhaps it's the record warming on offer this winter which may lead to something special later on.

    If anyone has a detailed explanation then please post.


  • Closed Accounts Posts: 2,693 ✭✭✭Redsunset


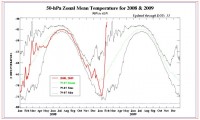
    here's a great website to moniter all today's strat temps in each sector and past temps www.cpc.noaa.gov/products/stratosphere/temperature/


  • Closed Accounts Posts: 2,693 ✭✭✭Redsunset


    check out the 10-hpa zonal temp in the 90N-65N. click on 10mb.and low and behold a new record.it's goin off the graph.they may increase it ha ha now thats impressive.


  • Closed Accounts Posts: 2,693 ✭✭✭Redsunset


    10mb9065.gif


  • Advertisement
  • Closed Accounts Posts: 110 ✭✭tony1212


    hey guys, i just have to ask one thing, what does all of the above mean for ireland


  • Closed Accounts Posts: 2,693 ✭✭✭Redsunset


    tony1212 wrote: »
    hey guys, i just have to ask one thing, what does all of the above mean for ireland
    right i'll make this very simple.we're expecting the winds to reverse and the splitting of the vortex so cold air can begin to flood down over the northern hem.now this is all very well in theory.it is still forecast but what regions as of yet we don't know.heres hopin little old ireland stands in its way:D


  • Closed Accounts Posts: 2,693 ✭✭✭Redsunset


    negative 10-hpa zonal winds imminent folks.that means now a major warming.they should hold for a while bofore goin back positive to give fairly different surface conditions ie cold.ya see the beauty bout this is even tho this happens every year,its the fact that it rarely happens in jan and we,ve broken records that gives us great chance of mad cold weather.surface conditions do be naturally too warm when it has peaked mid feb and march previous years.we,re still in winter this time and thats what makes it oh the more beautiful.here's still hoping all goes well cause we're not by any means there yet.


  • Closed Accounts Posts: 311 ✭✭forkassed


    I know nowt about stratospheric warming, but atleast theres hints of an easterly airflow later on in the models the last few days.

    Hopefully we see some upgrades instead of the traditional downgrades.;)


  • Closed Accounts Posts: 2,693 ✭✭✭Redsunset


    great blog here that explains alot bout strat warming and whats happening now and how the warming makes us cold. www.keeneweather.blogspot.com/


  • Advertisement
  • Closed Accounts Posts: 2,693 ✭✭✭Redsunset


    we now have the mean zonal winds easterly and the polar vortex split.difficult subject i know but this i feel is what we're lookin at in the future to forecast world weather more precise.can't wait to see what transfers down to the troposphere.it has to be something good.the next couple of weeks should be revealing all.if nothing happens i'll eat my hat.


  • Closed Accounts Posts: 2,693 ✭✭✭Redsunset


    morning all.im goin to post the strat temp charts here now.starting at the middle of the strat and working down .you'll see all temps in real time every day as the warming moves down right through to the bottom of the strat.notice how she cools again as the warming sinks.eh naturally i hear you say ha. so here goes , 10mb9065.gif30mb9065.gif50mb9065.gif70mb9065.gif


  • Closed Accounts Posts: 2,693 ✭✭✭Redsunset


    that seem to have come out all over the shop on my pc.got to scroll across to find the first graph 10hpa working down to 70hpa.sorry bout that


  • Closed Accounts Posts: 2,693 ✭✭✭Redsunset


    Good chart to highlight the warming moving down through the strat.could be a very long time before we see anything as severe as this strat warming.very glad to have learned so much from this.time_pres_TEMP_ANOM_JFM_NH_2009.gif


  • Closed Accounts Posts: 2,693 ✭✭✭Redsunset


    just look at the split polar vortex now caressing scandinavia.she's a coming soon.:eek:2009012800.10oa.nh.gif


  • Closed Accounts Posts: 2,693 ✭✭✭Redsunset


    STRATALERT TOKYO
    STRATALERT TOKYO 28 JAN2009 0130 UTC30-HPA ANALYSIS 1200UTC 26 JAN1. COLD MINUS 75 45N 96W, COLD MINUS 81 53N 65E, WARM MINUS 24 75N 57W, WARM MINUS 34 53N 120E, LOW 224 63N 83E, LOW 229 60N 85W, HIGH 411 63N 172W. HIGH 400 51N 24W.2. CONDITIONS AT 30-HPA HEIGHT FIELD, THE POLAR VOLTEXES REMAINS TO BE SPLIT AND ARE LOCATED OVER WESTERN SIBERIA AND HUDSON BAY. COLD AIRS LIE OVER CENTRAL ASIA AND CENTRAL CANADA. WARM AIRS LIE OVER GREENLAND AND TO THE EAST OF LAKE BAIKAL. REGARDING ZONAL MEAN FIELD, EASTERLY WIND IS OBSERVED ABOVE 70-HPA OVER THE POLAR REGION. TEMPERATURE INCREASES POLEWARD FROM 60N ABOVE 100-HPA.3. STRATALERT EXISTS. MAJOR WARMING HAS CONTINUED AT 30-HPA. TEMPERATURE OVER THE POLAR REGION HAS INCREASED WITH MAXIMUM 53 DEGREES FROM 19 TO 26 JAN.REMARK: THE HEIGHT DATA SHOULD BE READ IN DECAMETERS ADDING 20 KILOMETERS.=AS YOU CAN SEE ALL STILL GOING GREAT:D


  • Closed Accounts Posts: 311 ✭✭forkassed


    What are ye doin up at this hour redsunset:)I had a read of the thread on netweather about this stratospheric warming...if it plays out the way they think, next weeks cold is only the beginning of something special.


  • Closed Accounts Posts: 2,693 ✭✭✭Redsunset


    take note folks of second chart in grid especially cause the longer those winds remain below the zero line,the longer the easterly lasts.as you can see it projected to remain for a while.:Dfluxes.gif


  • Closed Accounts Posts: 2,693 ✭✭✭Redsunset


    this is a section from timesonline.
    So why has this winter suddenly turned so nasty? The blame lies in the stratosphere, 6 to 30 miles (10km to 50km) high, where the winds usually blow around the globe from west to east.
    Forecasters spotted something strange two weeks ago, when the temperature of the stratosphere over the Arctic suddenly shot up by about 50C, an extraordinary event. This sounded alarm bells because it signalled that the winds had done a somersault, blowing from east to west.
    The raised temperature was explained by the hugely increased volume of air in the stratosphere.
    Although this easterly wind began at the top of the stratosphere, 30 miles high, it worked its way down over the following fortnight into the bottom layer of the Earth’s atmosphere, the troposphere, where all our weather happens, and sent easterly winds racing across into Britain.
    “It’s all about which way the winds blow,” Adam Scaife, at the Met Office’s Hadley Climate Centre, said. “When the stratosphere really puts its foot down, the troposphere responds by turning easterly, and so cold air from Siberia blows over us.”
    The bad news is that it can take several weeks for the stratosphere to return to normal. The last time this happened was in the winter of 2005-06, when Europe froze, buildings collapsed under the weight of snow and the cold lasted well into March. Britain escaped that time, but the stratosphere reversal is particularly strong on this occasion and there can be no escape.
    The outlook for the rest of February is not good either. It takes several weeks for the stratosphere to relax and return to its usual westerly direction.
    “We expect the cold to last the whole of February, on average, with dry or average rainfall.
    IMO THE BEST IS YET TO COME.THAT WAS THE STARTERS.SHE'LL COME IN WAVES.LIKE I'VE BEEN SAYIN ALL ALONG.MID FEB AND AFTER.IN SAYING THAT IF IT HAPPENS OVER IRELAND.WE DO MISS OUT SOMETIMES.REST OF EUROPE GETS A PASTING HOWEVER WITH IT BEING RECORD BREAKING STRONG THIS YEAR I'D EXPECT THE BEASTERLY OR NORTHERLY TO REACH US THIS TIME.NOTHING IS EVER GUARANTEED BUT THERE WILL BE A FIERCE AMOUNT OF DISAPPOINTED IF NOWT COMES OUT OF THIS.


  • Closed Accounts Posts: 2,693 ✭✭✭Redsunset


    BETTER UNDERSTANDING OF THE NAO THAT IS JUST ONE OF THE TELECONNECTIONS INVOLVED WITH HELPING STRAT WARMING MAKE US COLDER.
    [FONT=verdana,arial]One of the most prominent teleconnection patterns in all seasons is the North Atlantic Oscillation (NAO) (Barnston and Livezey 1987). The NOA combines parts of the East-Atlantic and West Atlantic patterns originally identified by Wallace and Gutzler (1981) for the winter season. The NAO consists of a north-south dipole of anomalies, with one center located over Greenland and the other center of opposite sign spanning the central latitudes of the North Atlantic between 35°N and 40°N. The positive phase of the NAO reflects below-normal heights and pressure across the high latitudes of the North Atlantic and above-normal heights and pressure over the central North Atlantic, the eastern United States and western Europe. The negative phase reflects an opposite pattern of height and pressure anomalies over these regions. Both phases of the NAO are associated with basin-wide changes in the intensity and location of the North Atlantic jet stream and storm track, and in large-scale modulations of the normal patterns of zonal and meridional heat and moisture transport (Hurrell 1995), which in turn results in changes in temperature and precipitation patterns often extending from eastern North America to western and central Europe (Walker and Bliss 1932, van Loon and Rogers 1978, Rogers and van Loon 1979). [/FONT]
    [FONT=verdana,arial]Strong positive phases of the NAO tend to be associated with above-averagel temperatures in the eastern United States and across northern Europe and below-average temperatures in Greenland and oftentimes across southern Europe and the Middle East. They are also associated with above-average precipitation over northern Europe and Scandinavia in winter, and below-average precipitation over southern and central Europe. Opposite patterns of temperature and precipitation anomalies are typically observed during strong negative phases of the NAO. During particularly prolonged periods dominated by one particular phase of the NAO, anomalous height and temperature patterns are also often seen extending well into central Russia and north-central Siberia. [/FONT]
    [FONT=verdana,arial]The NAO exhibits considerable interseasonal and interannual variability, and prolonged periods (several months) of both positive and negative phases of the pattern are common. The wintertime NAO also exhibits significant multi-decadal variability (Hurrell 1995, Chelliah and Bell 2005). For example, the negative phase of the NAO dominated the circulation from the mid-1950's through the 1978/79 winter. During this approximately 24-year interval, there were four prominent periods of at least three years each in which the negative phase was dominant and the positive phase was notably absent. In fact, during the entire period the positive phase was observed in the seasonal mean only three times, and it never appeared in two consecutive years. [/FONT]
    [FONT=verdana,arial]An abrupt transition to recurring positive phases of the NAO then occurred during the 1979/80 winter, with the atmosphere remaining locked into this mode through the 1994/95 winter season. During this 15-year interval, a substantial negative phase of the pattern appeared only twice, in the winters of 1984/85 and 1985/ 86. However, November 1995 - February 1996 (NDJF 95/96) was characterized by a return to the strong negative phase of the NAO. Halpert and Bell (1997; their section 3.3) recently documented the conditions accompanying this transition to the negative phase of the NAO.[/FONT]

    skipgraphic.gif www.nws.noaa.gov noaaleft.jpgnws_title.jpgnwsright.jpgcpc.jpgnavbarleft.jpgHomeSite MapNewsOrganizationSearch navbarendcap.jpg
    Search the CPC Climate Outlooks

    Climate & Weather Link
    El Niño/La Niña
    MJO
    Teleconnections
    AO
    NAO
    PNA
    AAO
    Blocking
    Storm Tracks

    Climate Glossary

    Outreach

    About Us
    Our Mission
    Who We Are

    Contact Us
    CPC Information
    CPC Web Team

    usagov_logo_color_110wb.gif[FONT=verdana,arial,serif]HOME > Climate & Weather Linkage > Teleconnections > North Atlantic Oscillation > GFS Outlooks[/FONT] MWandC.gif [FONT=verdana,arial,serif]The daily NAO indices are shown for the previous 120 days, and the GFS forecasts of the daily NAO index at selected lead times are appended onto the time series. The indices are standardized by standard deviation of the observed monthly NAO index from 1950-2000 interpolated to the day in question. A 3-day running mean is applied to the forecast time series.[/FONT]
    [FONT=verdana,arial,serif][/FONT]
    [FONT=verdana,arial,serif]The values at the upper left and right corner of each figure indicate the mean value of the NAO index and the correlation coefficients between the observation and the forecasts, respectively.[/FONT]

    nao.mrf.gifNOAA/ National Weather Service
    National Centers for Environmental Prediction
    Climate Prediction Center
    5200 Auth Road
    Camp Springs, Maryland 20746
    Page Author: Climate Prediction Center Internet Team
    Page last modified: December 12, 2005Disclaimer
    Information Quality
    Credits
    Glossary
    Privacy Policy
    Freedom of Information Act (FOIA)
    About Us
    Career Opportunities


  • Advertisement
  • Registered Users Posts: 16,624 ✭✭✭✭nacho libre


    "The bad news is that it can take several weeks for the stratosphere to return to normal. "

    that's not bad news it's great news:pac:


  • Closed Accounts Posts: 2,693 ✭✭✭Redsunset


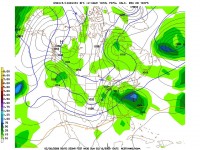
    INDICATION OF THE STRAT WARMING COMING INTO PLAY HERE WITH THIS FORECAST BLOCKING.HOPE IT PANS OUT.

    NHAB_banner.gif [FONT=verdana,arial,serif]The series of maps below show the 500 hPa height field along with the corresponding anomalies (colored) from the 22 year climatology (1979-2000) for the current 00Z GFS forecast verifying at the indicated time. At the top of each panel the blocking index strength is shown in units of (m/deg lat).[/FONT]
    forecast_3_nh.gif


  • Closed Accounts Posts: 311 ✭✭forkassed


    Got this link from NW..animation making the graphs above a bit easier to visualize whats happening.

    http://www.cpc.ncep.noaa.gov/products/intraseasonal/temp10anim.shtml


  • Closed Accounts Posts: 2,693 ✭✭✭Redsunset


    forkassed wrote: »
    Got this link from NW..animation making the graphs above a bit easier to vusualize whats happening.

    http://www.cpc.ncep.noaa.gov/products/intraseasonal/temp10anim.shtml
    excellent stuff.love where ya can see the ao begin in asia.mark my words this will be big.just need all factors to play ball with us and i feel they are cause our cold spell keeps gettin extended:D


  • Closed Accounts Posts: 2,693 ✭✭✭Redsunset


    ACHTUNG BABY!!!

    THE YANKS SEE IT COMING TO US ALL!!!

    GREAT INFO FROM NW.

    blogosphere.jpg
    Feb 05, 2009
    Super Strong Stratospheric Warming Event to Bring More Cold and Snow as Grand Finale to 08/09 Winter By Joseph D’Aleo, CCM, AMS Fellow
    It has been a top ten coldest winters for the first two months of the year in parts of the central states. After a bit of a roller coaster ride with even a warm day or two (first in many weeks) the next week, a major stratospheric warming event that began last month will translate down to the mid and lower atmosphere with amazing high latitude blocking - high pressure. Cooling will start the end of next week and continue the rest of the month at least.
    Super_SSW_thumb.jpg
    Larger imager here.
    As cold expanding high pressure expands south into the lower 48 next week, it will suppress the jet stream and its associated still active storm track well south resulting in a MEMORABLE wintry weather period that will in the end when taken together with the cold in December and January have this winter remembered as an old-fashioned 1960s like winter. Many places deep into the south and east will see heavy snow and ice while unseasonably cold air dominates across the north.
    GFSFcstlatefeb_thumb.jpg
    Larger imager here.
    In the end the CPC winter forecast from October 16 based mainly on decadal trends (thought to represent global warming) will be a decided bust. Like the stock market, technical traders will tell you, trends can take you only so far. They invariably reverse.
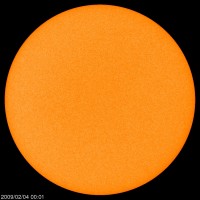
    More cold will occur in the UK and Western Europe, where the warm winter forecast by the UKMO also never materialized. Even the forecasters in the UK have noted some similarity to the 1960s and mentioned the early 1800s. Surprisingly that is what the low solar (sun still spotless like a Florida orange which ironically this morning are caked in ice with temperatures down into the 20s � 23 in Palmdale) suggests � a return to the early 1800s Dalton like minimum weather.
    Sun020509_thumb.jpg
    Larger imager here.
    In the end the CPC winter forecast from October 16 based mainly on decadal trends (thought to represent global warming) will be a decided bust. Like the stock market, technical traders will tell you, trends can take you only so far. They invariably reverse.
    More cold will occur in the UK and Western Europe, where the warm winter forecast by the UKMO also never materialized. Even the forecasters in the UK have noted some similarity to the 1960s and mentioned the early 1800s. That is what the continuing extremely quiet sun (still spotless like a Florida orange which ironically this morning are caked in ice with temperatures down into the 20s, 23 in Palmdale) and an analysis of past cycles suggests a return to the early 1800s Dalton like minimum weather.
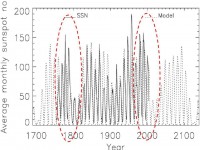
    CLILVERD_thumb.jpg
    Larger imager here.
    The last four cycles were very similar to late 1700s prior to the Dalton Minimum, which makes sense given the phasing of the 106 and 212 year minima the next few decades (Clilverd et al 2006 forecast shown).
    Should Alaska’s Mt. Redoubt blow big soon, that would translate into a cooler than normal summer and another cold winter next year with more blocking like we see upcoming even if a weak El Nino developed. El Ninos do occur in cold PDO phases but are weaker and briefer thus usually colder. Than again if the sun stays quiet, La Nina may not disappear. La Ninas dominate at solar minima. See PDF here.


  • Closed Accounts Posts: 2,693 ✭✭✭Redsunset


    I'VE TAKEN THIS FROM A POST ON NW BECAUSE IT BRILLIANTLY PUTS INTO WORDS WHAT HAS HAPPENED AND WHAT IS ABOUT TO:D

    Look at the stratospher/troposphere/model sequence/surface response so far this winter-

    Average conditions prevailed in the stratosphere to start the winter, and we witnessed an Asian mountain torque event that precipitated a couple of negative zonal anomalies to propogate to the troposphere. This lead to the blocked and cold period we witnessed through xmas, New Year and nearly the first third of January.

    Now, at the same time as we were enjoying the first cold spell, we saw a distinct cooling in the stratosphere and it was no coincidence that towards the middle of January we saw the increase in westerly zonal winds, associated with that cooling, and this manifested itself in the return of the northern jet and a zonal pattern as we know for most of the rest of the month.

    Now, while the zonal period was in full swing, we have witnessed another mountain event, a much larger one than the previous one. This is one of the main factors behind triggering the unprecedented MMW that has produced a reverse (easterly) switch in zonal winds in the stratopshere and these have been monitored (as per stratosphere thread) in terms of their propagation process towards the troposphere (and hence towards the time when the models start to pick up on the downwelling of the negative zonal winds in response to this) We must remember that this is a much larger scale feature than pre xmas, and we are talking about a reverse switch of polar westerly winds (which drives the low pressure and polar vortex) to a sustained easterly switch that rips up the polar vortex and kills off the energy of the zonal winds.

    So this brings us up to the present day and the final burst of westerly zone winds which are the precursor 'switch' prior to the polar easterlies. The model disagreement, as GP suggests, is down to how they handle this pulse of energy before it dissipates. As he suggests, ECM is more superior in modelling the upper atmosphere and it has called each successive pattern correctly all this winter. Before the GFS. That includes the switch back to zonality earlier in January. On that occassion, GFS was hanging on to the blocking longer than ECM, although it is acknowledged that ECM was a day or two progressive with the return of the atlantic.

    Similarly, I would suggest the same is true here and at worst the ECM is trying to bring in the high latitude blocking in rsponse to the MMW a day or two too soon - and merely briefly postphoning the ineveitable.

    Sorry about the long post but I think this hopefully will demonstrate how the stratosphere is a very dominant driver in our winter patterns - especially from january onwards when the state of the stratosphere, cold or warm, in turns impacts on the strength of the polar westerlies, which in turn impacts as one of the main determinators on jet strength and the ability of blocking to hold. There are others, like the GlobalWind Oscillation which measures low pressure strength etc, but as even Met Office spokesmen have suggested, this event has already made its impact in terms of the pre emptive effect on the atmosphere. They have also suggested thats effects will be felt for some weeks to come. So it is fact not theory. smile.gif

    The publicity that this event has taken attention, shows that it is not only winter cold forum members who eshew the virtues of a warm stratosphere


  • Closed Accounts Posts: 2,693 ✭✭✭Redsunset


    NOW FOLKS,I KNOW IM PROB TAKEN THE P1SS HERE ABIT BUT COULD WE BE SEEIN CHARTS LIKE THIS THAT AREN'T SO FI SOON.
    RESULT OF STRAT WARMING???
    I SURE THINK SO.I'LL LEAVE IT AT THAT FOR NOW.

    gfs-1-384.png?12


  • Closed Accounts Posts: 2,693 ✭✭✭Redsunset


    redsunset wrote: »
    great blog here that explains alot bout strat warming and whats happening now and how the warming makes us cold. www.keeneweather.blogspot.com/

    THIS SITE I POSTED EARLIER NO LONGER EXPLAINS HOW THE STRAT WARMING FORMS ORIGINALLY BUT HAS BEEN UPDATED ON TO SHOW TEMP AND WINDS CHARTS SHOWING THEM SLOWING SINKING INTO TROPOSPHERE LAYER(THE PART WE LIVE IN).I SEE ITS SHOWING A TEMPORARILY BURST OF WESTERLY WIND AT THE MO.


  • Closed Accounts Posts: 12,456 ✭✭✭✭Mr Benevolent


    For easier reading can you turn off your capslock? It's tough to read capitals. Also, it's considered shouting :D


  • Advertisement
  • Registered Users Posts: 16,624 ✭✭✭✭nacho libre


    i want the effects of this stratospheric warming to deliver us an epic event before this winter (it still is winter for meteorologists) says goodbye to us.

    epic from my perspective would be at least four-five inches of lying snow over much of the country.

    a polar low would be ideal, where we get four to five hours of heavy snow followed by a succession of troughs coming down from the north in bitter polar air, which results in prolonged spells of heavy snow for many.

    it's not too much to ask, is it?


Advertisement