Advertisement
If you have a new account but are having problems posting or verifying your account, please email us on hello@boards.ie for help. Thanks :)
Hello all! Please ensure that you are posting a new thread or question in the appropriate forum. The Feedback forum is overwhelmed with questions that are having to be moved elsewhere. If you need help to verify your account contact hello@boards.ie
Hi there,
There is an issue with role permissions that is being worked on at the moment.
If you are having trouble with access or permissions on regional forums please post here to get access: https://www.boards.ie/discussion/2058365403/you-do-not-have-permission-for-that#latest

What is the coldest temperature an aircraft could be subjected to?

  • 14-06-2010 3:48am
    #1
    Registered Users, Registered Users 2 Posts: 78,580 ✭✭✭✭


    As we ascend through the atmosphere temperature drops. Various charts here http://www.google.ie/images?um=1&hl=en&tbs=isch%3A1&sa=1&q=air+temperature+%2Baltitude&aq=f&aqi=&aql=&oq=&gs_rfai= indicate that at about 10-17km altitude (varies with latitude), we reach the Tropopause, the line between the Troposphere and Stratosphere. Above this point, temperatures increase again because of the ozone layer. This is the altitude that many commercial aircraft fly at, other factors excepting.

    These graphs indicate a temperature of -60 to -80C at the Tropopause. However, this is with a ground temperature of 10C to 20C. If we took the most extreme conditions globally, what is the coldest that the Tropopause can be? And correspondingly what is the coldest temperature a normal* aircraft could be subjected to?


    * Military aircraft can operate at 20-30km altitude.


Comments

  • Closed Accounts Posts: 4,279 ✭✭✭Su Campu


    Just remember those charts are of the Standard Atmosphere, which on most days is far from the real setup. The surface temperature is no indication of the height of the tropopause. You could have 30°C at the surface, but if there were an upper low above it, the tropopause could be much lower than somewhere with 15°C and an upper high. In some cases, the tropopause has been down as low as 24,000ft over Ireland, and can get up to 55,000ft in places. But I have seen it on days where it's been FL250 over northern Africa and FL400 over Ireland. So on any one flight a plane can fly at the same "height" but still be flying in both the troposphere and stratosphere along its trip. But averaged out over time, the tropopause height is related to the average temperature throughout the troposphere, with the tropics being higher than the poles.

    This is a SigWx chart for the Atlantic region for this evening. The 3-digit numbers in the boxes indicate the tropopause height. It's at FL440 (44,000ft) just west of Portugal, FL340 west of Ireland, and only FL200 between Canada and Greenland. Note the FL510 dome where the Bermuda high is. The H or L figures with the triangular tops or bottoms show where the tropopause is at its max (dome) or minimum (sink), respectively.

    10061418_1318.gif


    This chart shows the winds and temperatures at FL390 (39,000ft). You can see temperatures go from near -60°C to -41°C for a flight from Ireland to the US. I haven't seen much colder than -60°C for this altitude, but I'm not sure what's the coldest a plane can take.

    116891.JPG

    On any one day you can easily see what the tropopause height is for a location by looking at a sounding. Where the temperature curve kinks to the right and follows the isotherms is where the stratopshere starts. The Valentia sounding for 06Z this morning shows it at around 12,300m (~FL380) and -60°C.

    2010061406.03953.skewt.gif


  • Registered Users, Registered Users 2 Posts: 78,580 ✭✭✭✭Victor


    How do you read the last chart? It has no units and the colour coordination is a bit mixed up.


  • Closed Accounts Posts: 4,279 ✭✭✭Su Campu


    Victor wrote: »
    How do you read the last chart? It has no units and the colour coordination is a bit mixed up.

    The two thick black curves are the actual temperature (right) and dewpoint (left) curves measured by the radiosonde. Pressure is on the left axis, the thin straight blue diagonal lines going towards the top right are isotherms (marked on the bottom axis in °C), the straight green lines are Dry Adiabats (how a dry air parcel's temperature will fall as it is raised), the curved blue lines are the Wet Adiabats (how a saturated parcel's temperature will fall as it is raised) and the pink diagonal lines are the mixing ratio lines (amount of water in the atmosphere, in g/kg).

    You can see the temperature and dewpoint of the atmosphere at any height (pressure level) by looking across the pressure level and reading where the two curves lie in relation to the blue isotherms. The nearer the two curves are together the higher the relative humidity. Where they touch is where it is saturated (cloudy). You can precict how a surface air parcel will behave when it is heated by taking the temperature curve from the surface along the green adiabat, and the dewpoint curve along the pink MR lines. Where the two meet is where the parcel will become saturated, and any further lifting will result in cloudiness and will follow the curved blue wet adiabats.

    These charts are a very useful forecasting tool and can pick up minor details that the models can miss.

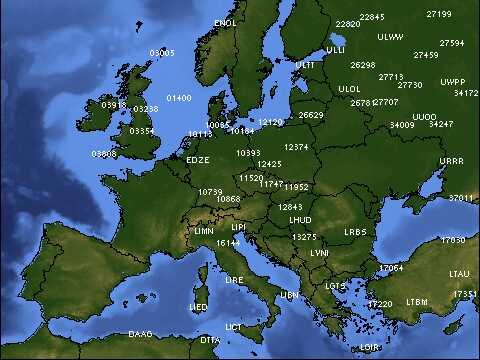
    europe.jpg


Advertisement